Add metrics for the Netty internals
Firstly, there is nothing in the docs regarding what metrics are collected, and how to disable metrics collections. I asked in https://github.com/yidongnan/grpc-spring-boot-starter/issues/239 if more details could be added.
Then, looking at the metrics collecting interceptors, it seems the request and response are counted globally without any reference to the RPC method. This doesn't really make sense, because either the client or the server could send streaming messages that'd increment these counter. This is misleading since the timer times the complete call, not individual request/response.
Lastly, thread pool information on the server and client side is crucial to have.
I've a project that addresses the last two issues; it's not based on Spring Boot (deliberate choice), or grpc-spring-boot-starter, but uses Micrometer.
https://github.com/asarkar/kotlin/tree/master/grpc-learning
Firstly, there is nothing in the docs regarding what metrics are collected, and how to disable metrics collections. I asked in #239 if more details could be added.
Added to the TOD list. See the issue for more details.
Then, looking at the metrics collecting interceptors, it seems the request and response are counted globally without any reference to the RPC method.
This is not true. See here for the implementation. Rough outline of the workflow:
- Incoming call
- Extract target method
- Get (cached)
MetricSetfor the grpc method - Attach the MetricSet to the call
- Count the incoming requests
- Count the outgoing responses
- Time the total request duration and result status.
This is misleading since the timer times the complete call, not individual request/response.
Currently we only count the requests and responses, because in streaming calls there is no semantic relation between the requests and responses (e.g. a chat application). However, we do time the duration of the entire call and thus the total number of calls.
Lastly, thread pool information on the server and client side is crucial to have.
Sounds like a good idea. Do you have a recommendation for a visualization of the related metrics?
I've a project that addresses the last two issues; it's not based on Spring Boot (deliberate choice), or grpc-spring-boot-starter, but uses Micrometer.
https://github.com/asarkar/kotlin/tree/master/grpc-learning
Thanks for your suggestions, we will look into it. Do you have any intention/interest in contributing your proposal as PR?
Here are some screenshots that demonstrate/visualize the current metrics:
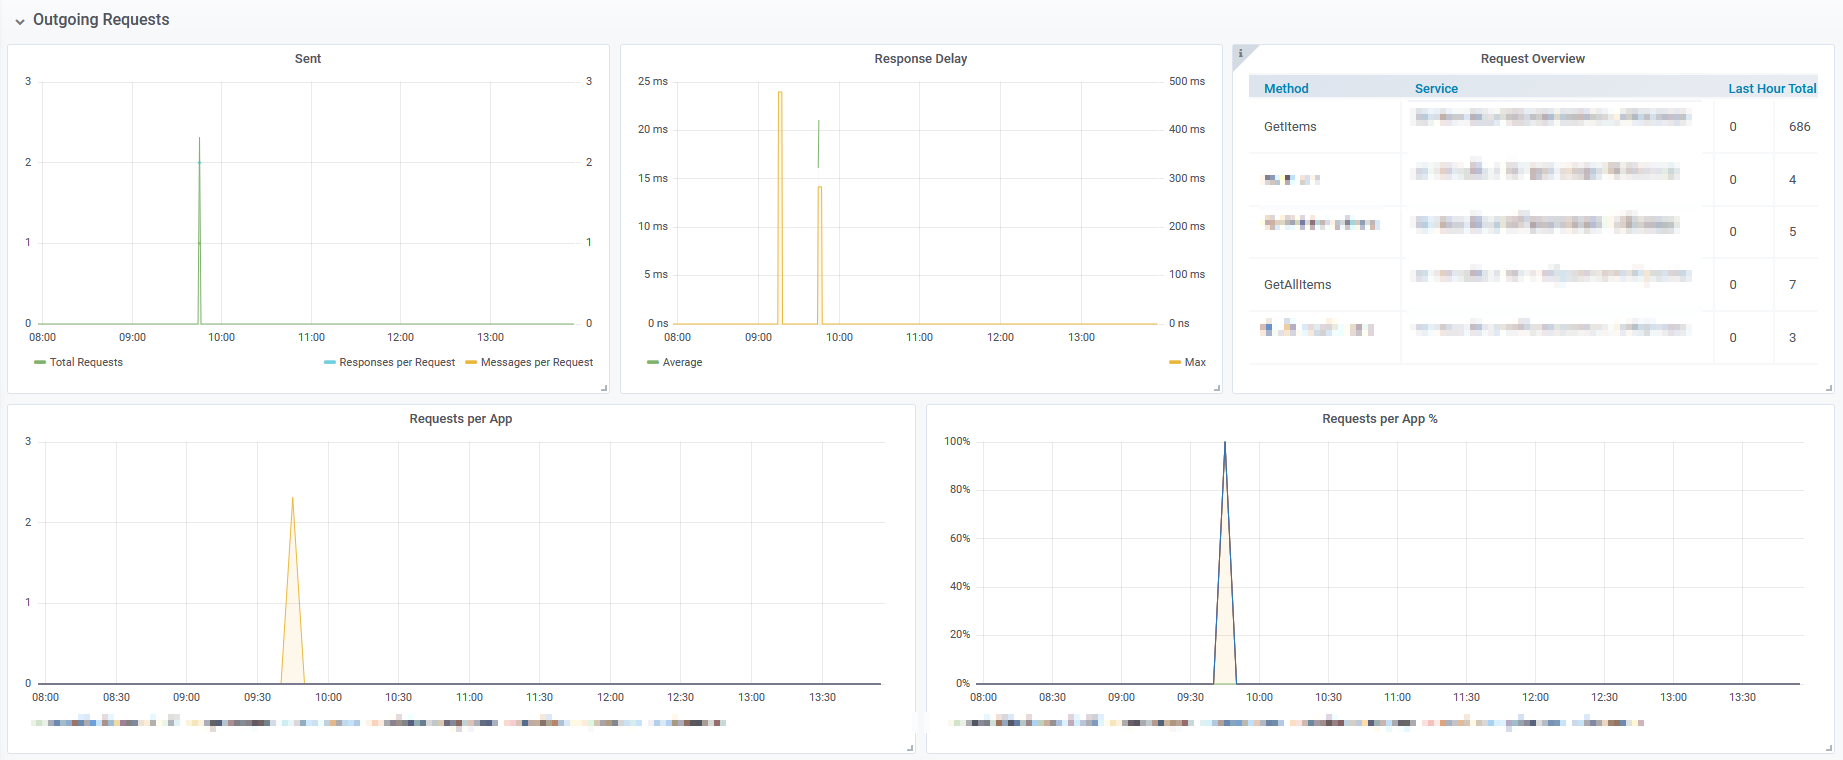
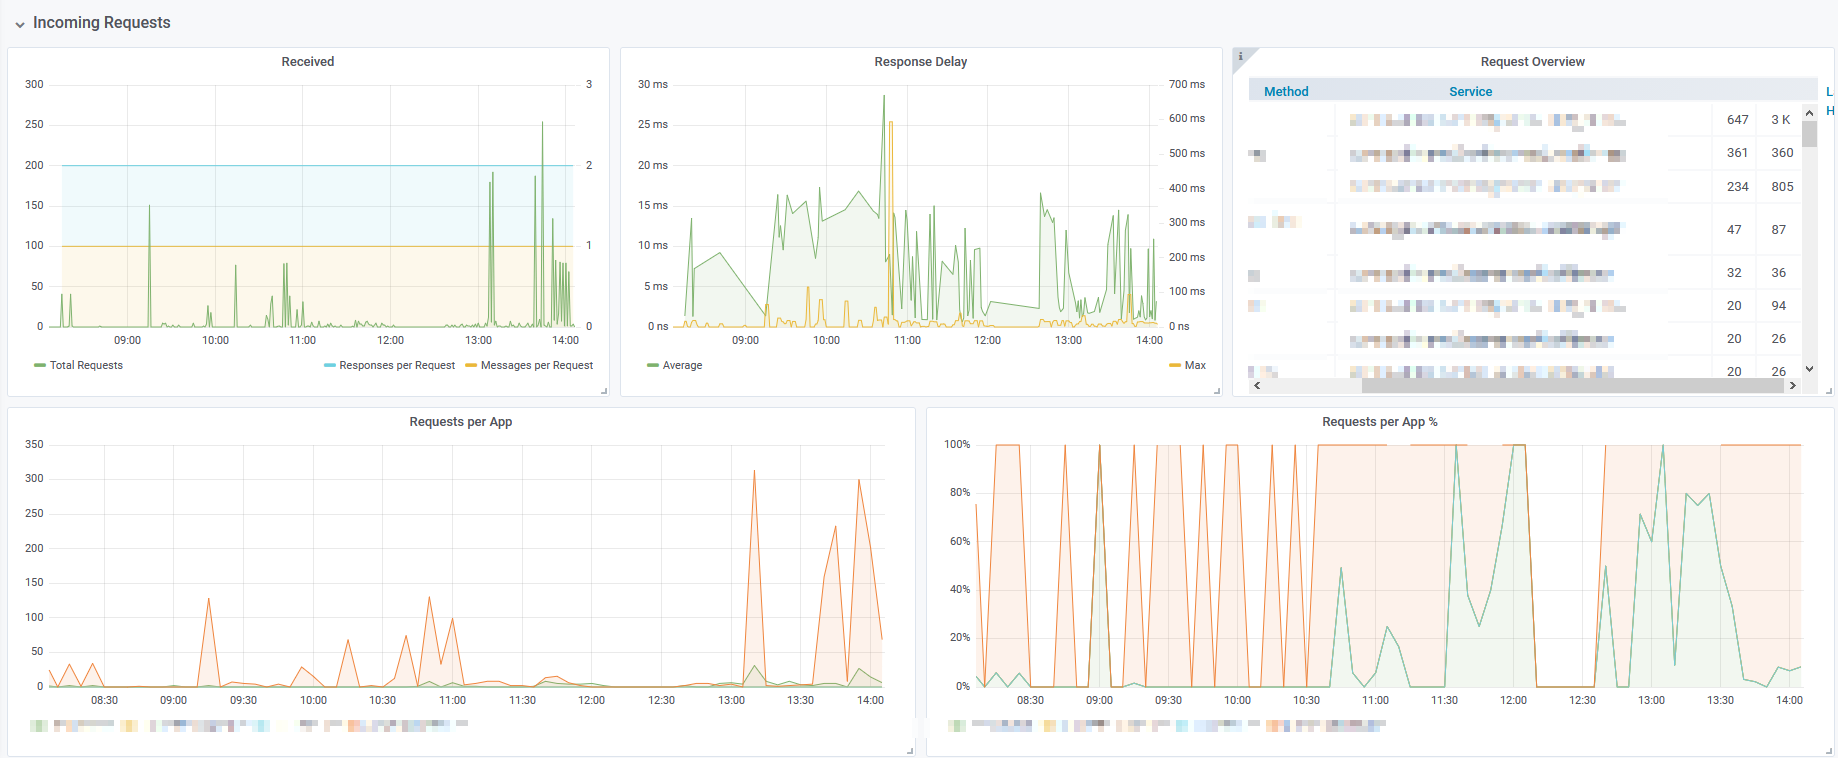
Grafana-Dashboard (click to expand)
{
	"annotations": {
		"list": [{
				"builtIn": 1,
				"datasource": "-- Grafana --",
				"enable": true,
				"hide": true,
				"iconColor": "rgba(0, 211, 255, 1)",
				"name": "Annotations & Alerts",
				"type": "dashboard"
			}
		]
	},
	"description": "GRPC-Service-Übersicht",
	"editable": true,
	"gnetId": null,
	"graphTooltip": 0,
	"id": 1,
	"links": [],
	"panels": [{
			"collapsed": false,
			"gridPos": {
				"h": 1,
				"w": 24,
				"x": 0,
				"y": 0
			},
			"id": 13,
			"panels": [],
			"title": "Outgoing Requests",
			"type": "row"
		}, {
			"aliasColors": {},
			"bars": false,
			"dashLength": 10,
			"dashes": false,
			"fill": 1,
			"gridPos": {
				"h": 9,
				"w": 8,
				"x": 0,
				"y": 1
			},
			"id": 14,
			"legend": {
				"avg": false,
				"current": false,
				"max": false,
				"min": false,
				"show": true,
				"total": false,
				"values": false
			},
			"lines": true,
			"linewidth": 1,
			"links": [],
			"nullPointMode": "connected",
			"percentage": false,
			"pointradius": 5,
			"points": false,
			"renderer": "flot",
			"seriesOverrides": [{
					"alias": "Messages per Request",
					"yaxis": 2
				}, {
					"alias": "Responses per Request",
					"yaxis": 2
				}, {
					"alias": "Total Requests",
					"stack": false,
					"zindex": 3
				}
			],
			"spaceLength": 10,
			"stack": true,
			"steppedLine": false,
			"targets": [{
					"expr": "sum(increase(grpc_client_processing_duration_seconds_count[1m]))",
					"format": "time_series",
					"instant": false,
					"interval": "1m",
					"intervalFactor": 1,
					"legendFormat": "Total Requests",
					"refId": "A"
				}, {
					"expr": "sum(increase(grpc_client_requests_sent_messages_total[1m])) / sum(increase(grpc_client_processing_duration_seconds_count[1m]))",
					"format": "time_series",
					"interval": "1m",
					"intervalFactor": 1,
					"legendFormat": "Messages per Request",
					"refId": "B"
				}, {
					"expr": "sum(increase(grpc_client_responses_received_messages_total[1m])) / sum(increase(grpc_client_processing_duration_seconds_count[1m]))",
					"format": "time_series",
					"interval": "1m",
					"intervalFactor": 1,
					"legendFormat": "Responses per Request",
					"refId": "C"
				}
			],
			"thresholds": [],
			"timeFrom": null,
			"timeRegions": [],
			"timeShift": null,
			"title": "Sent",
			"tooltip": {
				"shared": true,
				"sort": 0,
				"value_type": "individual"
			},
			"type": "graph",
			"xaxis": {
				"buckets": null,
				"mode": "time",
				"name": null,
				"show": true,
				"values": []
			},
			"yaxes": [{
					"decimals": 0,
					"format": "short",
					"label": null,
					"logBase": 1,
					"max": null,
					"min": "0",
					"show": true
				}, {
					"decimals": 0,
					"format": "short",
					"label": null,
					"logBase": 1,
					"max": null,
					"min": "0",
					"show": true
				}
			],
			"yaxis": {
				"align": false,
				"alignLevel": null
			}
		}, {
			"aliasColors": {
				"Max-Request-Duration": "#bf1b00"
			},
			"bars": false,
			"dashLength": 10,
			"dashes": false,
			"fill": 1,
			"gridPos": {
				"h": 9,
				"w": 8,
				"x": 8,
				"y": 1
			},
			"id": 15,
			"legend": {
				"avg": false,
				"current": false,
				"max": false,
				"min": false,
				"show": true,
				"total": false,
				"values": false
			},
			"lines": true,
			"linewidth": 1,
			"links": [],
			"nullPointMode": "connected",
			"percentage": false,
			"pointradius": 5,
			"points": false,
			"renderer": "flot",
			"seriesOverrides": [{
					"alias": "Max-Request-Duration",
					"yaxis": 2
				}, {
					"alias": "Max",
					"yaxis": 2
				}
			],
			"spaceLength": 10,
			"stack": false,
			"steppedLine": false,
			"targets": [{
					"expr": "sum(increase(grpc_client_processing_duration_seconds_sum[1m])) / sum(increase(grpc_client_processing_duration_seconds_count[1m]))",
					"format": "time_series",
					"hide": false,
					"intervalFactor": 1,
					"legendFormat": "Average",
					"refId": "A"
				}, {
					"expr": "max(grpc_client_processing_duration_seconds_max)",
					"format": "time_series",
					"hide": false,
					"intervalFactor": 1,
					"legendFormat": "Max",
					"refId": "B"
				}
			],
			"thresholds": [],
			"timeFrom": null,
			"timeRegions": [],
			"timeShift": null,
			"title": "Response Delay",
			"tooltip": {
				"shared": true,
				"sort": 0,
				"value_type": "individual"
			},
			"type": "graph",
			"xaxis": {
				"buckets": null,
				"mode": "time",
				"name": null,
				"show": true,
				"values": []
			},
			"yaxes": [{
					"format": "s",
					"label": null,
					"logBase": 1,
					"max": null,
					"min": "0",
					"show": true
				}, {
					"format": "s",
					"label": null,
					"logBase": 1,
					"max": null,
					"min": "0",
					"show": true
				}
			],
			"yaxis": {
				"align": false,
				"alignLevel": null
			}
		}, {
			"columns": [],
			"description": "The number of requests in the last hour",
			"fontSize": "100%",
			"gridPos": {
				"h": 9,
				"w": 8,
				"x": 16,
				"y": 1
			},
			"id": 18,
			"links": [],
			"pageSize": null,
			"scroll": true,
			"showHeader": true,
			"sort": {
				"col": null,
				"desc": false
			},
			"styles": [{
					"alias": "",
					"colorMode": null,
					"colors": [
						"rgba(245, 54, 54, 0.9)",
						"rgba(237, 129, 40, 0.89)",
						"rgba(50, 172, 45, 0.97)"
					],
					"dateFormat": "YYYY-MM-DD HH:mm:ss",
					"decimals": 2,
					"mappingType": 1,
					"pattern": "Time",
					"thresholds": [],
					"type": "hidden",
					"unit": "short"
				}, {
					"alias": "Service",
					"colorMode": null,
					"colors": [
						"rgba(245, 54, 54, 0.9)",
						"rgba(237, 129, 40, 0.89)",
						"rgba(50, 172, 45, 0.97)"
					],
					"dateFormat": "YYYY-MM-DD HH:mm:ss",
					"decimals": 2,
					"mappingType": 1,
					"pattern": "service",
					"thresholds": [],
					"type": "string",
					"unit": "short"
				}, {
					"alias": "Method",
					"colorMode": null,
					"colors": [
						"rgba(245, 54, 54, 0.9)",
						"rgba(237, 129, 40, 0.89)",
						"rgba(50, 172, 45, 0.97)"
					],
					"dateFormat": "YYYY-MM-DD HH:mm:ss",
					"decimals": 2,
					"mappingType": 1,
					"pattern": "method",
					"thresholds": [],
					"type": "string",
					"unit": "short"
				}, {
					"alias": "Last Hour",
					"colorMode": null,
					"colors": [
						"rgba(245, 54, 54, 0.9)",
						"rgba(237, 129, 40, 0.89)",
						"rgba(50, 172, 45, 0.97)"
					],
					"dateFormat": "YYYY-MM-DD HH:mm:ss",
					"decimals": 0,
					"mappingType": 1,
					"pattern": "Value #A",
					"thresholds": [],
					"type": "number",
					"unit": "short"
				}, {
					"alias": "Total",
					"colorMode": null,
					"colors": [
						"rgba(245, 54, 54, 0.9)",
						"rgba(237, 129, 40, 0.89)",
						"rgba(50, 172, 45, 0.97)"
					],
					"dateFormat": "YYYY-MM-DD HH:mm:ss",
					"decimals": 0,
					"mappingType": 1,
					"pattern": "Value #B",
					"thresholds": [],
					"type": "number",
					"unit": "short"
				}
			],
			"targets": [{
					"expr": "sort_desc(sum(increase(grpc_client_processing_duration_seconds_count[1h])) by (service, method))",
					"format": "table",
					"instant": true,
					"interval": "1h",
					"intervalFactor": 1,
					"legendFormat": "",
					"refId": "A"
				}, {
					"expr": "sort_desc(sum(grpc_client_processing_duration_seconds_count) by (service, method))",
					"format": "table",
					"instant": true,
					"intervalFactor": 1,
					"refId": "B"
				}
			],
			"title": "Request Overview",
			"transform": "table",
			"type": "table"
		}, {
			"aliasColors": {},
			"bars": false,
			"dashLength": 10,
			"dashes": false,
			"fill": 1,
			"gridPos": {
				"h": 9,
				"w": 12,
				"x": 0,
				"y": 10
			},
			"id": 19,
			"legend": {
				"avg": false,
				"current": false,
				"max": false,
				"min": false,
				"show": true,
				"total": false,
				"values": false
			},
			"lines": true,
			"linewidth": 1,
			"links": [],
			"nullPointMode": "null",
			"percentage": false,
			"pointradius": 5,
			"points": false,
			"renderer": "flot",
			"seriesOverrides": [],
			"spaceLength": 10,
			"stack": false,
			"steppedLine": false,
			"targets": [{
					"expr": "sum(increase(grpc_client_processing_duration_seconds_count[5m])) by (app)",
					"format": "time_series",
					"interval": "5m",
					"intervalFactor": 1,
					"legendFormat": "{{app}}",
					"refId": "A"
				}
			],
			"thresholds": [],
			"timeFrom": null,
			"timeRegions": [],
			"timeShift": null,
			"title": "Requests per App",
			"tooltip": {
				"shared": true,
				"sort": 0,
				"value_type": "individual"
			},
			"type": "graph",
			"xaxis": {
				"buckets": null,
				"mode": "time",
				"name": null,
				"show": true,
				"values": []
			},
			"yaxes": [{
					"decimals": 0,
					"format": "short",
					"label": null,
					"logBase": 1,
					"max": null,
					"min": "0",
					"show": true
				}, {
					"format": "short",
					"label": null,
					"logBase": 1,
					"max": null,
					"min": null,
					"show": true
				}
			],
			"yaxis": {
				"align": false,
				"alignLevel": null
			}
		}, {
			"aliasColors": {},
			"bars": false,
			"dashLength": 10,
			"dashes": false,
			"fill": 1,
			"gridPos": {
				"h": 9,
				"w": 12,
				"x": 12,
				"y": 10
			},
			"id": 9,
			"legend": {
				"avg": false,
				"current": false,
				"max": false,
				"min": false,
				"show": true,
				"total": false,
				"values": false
			},
			"lines": true,
			"linewidth": 1,
			"links": [],
			"nullPointMode": "null",
			"percentage": true,
			"pointradius": 5,
			"points": false,
			"renderer": "flot",
			"seriesOverrides": [],
			"spaceLength": 10,
			"stack": true,
			"steppedLine": false,
			"targets": [{
					"expr": "sum(increase(grpc_client_processing_duration_seconds_count[5m])) by (app)",
					"format": "time_series",
					"interval": "5m",
					"intervalFactor": 1,
					"legendFormat": "{{app}}",
					"refId": "A"
				}
			],
			"thresholds": [],
			"timeFrom": null,
			"timeRegions": [],
			"timeShift": null,
			"title": "Requests per App %",
			"tooltip": {
				"shared": true,
				"sort": 0,
				"value_type": "individual"
			},
			"type": "graph",
			"xaxis": {
				"buckets": null,
				"mode": "time",
				"name": null,
				"show": true,
				"values": []
			},
			"yaxes": [{
					"decimals": null,
					"format": "percent",
					"label": null,
					"logBase": 1,
					"max": "100",
					"min": "0",
					"show": true
				}, {
					"format": "short",
					"label": null,
					"logBase": 1,
					"max": null,
					"min": null,
					"show": false
				}
			],
			"yaxis": {
				"align": false,
				"alignLevel": null
			}
		}, {
			"collapsed": false,
			"gridPos": {
				"h": 1,
				"w": 24,
				"x": 0,
				"y": 19
			},
			"id": 11,
			"panels": [],
			"title": "Incoming Requests",
			"type": "row"
		}, {
			"aliasColors": {},
			"bars": false,
			"dashLength": 10,
			"dashes": false,
			"fill": 1,
			"gridPos": {
				"h": 9,
				"w": 8,
				"x": 0,
				"y": 20
			},
			"id": 2,
			"legend": {
				"avg": false,
				"current": false,
				"max": false,
				"min": false,
				"show": true,
				"total": false,
				"values": false
			},
			"lines": true,
			"linewidth": 1,
			"links": [],
			"nullPointMode": "connected",
			"percentage": false,
			"pointradius": 5,
			"points": false,
			"renderer": "flot",
			"seriesOverrides": [{
					"alias": "Messages per Request",
					"yaxis": 2
				}, {
					"alias": "Responses per Request",
					"yaxis": 2
				}, {
					"alias": "Total Requests",
					"stack": false,
					"zindex": 3
				}
			],
			"spaceLength": 10,
			"stack": true,
			"steppedLine": false,
			"targets": [{
					"expr": "sum(increase(grpc_server_processing_duration_seconds_count[1m]))",
					"format": "time_series",
					"interval": "60s",
					"intervalFactor": 1,
					"legendFormat": "Total Requests",
					"refId": "A"
				}, {
					"expr": "sum(increase(grpc_server_requests_received_messages_total[1m])) / sum(increase(grpc_server_processing_duration_seconds_count[1m]))",
					"format": "time_series",
					"interval": "60s",
					"intervalFactor": 1,
					"legendFormat": "Messages per Request",
					"refId": "B"
				}, {
					"expr": "sum(increase(grpc_server_responses_sent_messages_total[1m])) / sum(increase(grpc_server_processing_duration_seconds_count[1m]))",
					"format": "time_series",
					"interval": "60s",
					"intervalFactor": 1,
					"legendFormat": "Responses per Request",
					"refId": "C"
				}
			],
			"thresholds": [],
			"timeFrom": null,
			"timeRegions": [],
			"timeShift": null,
			"title": "Received",
			"tooltip": {
				"shared": true,
				"sort": 0,
				"value_type": "individual"
			},
			"type": "graph",
			"xaxis": {
				"buckets": null,
				"mode": "time",
				"name": null,
				"show": true,
				"values": []
			},
			"yaxes": [{
					"decimals": 0,
					"format": "short",
					"label": null,
					"logBase": 1,
					"max": null,
					"min": "0",
					"show": true
				}, {
					"decimals": 0,
					"format": "short",
					"label": null,
					"logBase": 1,
					"max": null,
					"min": "0",
					"show": true
				}
			],
			"yaxis": {
				"align": false,
				"alignLevel": null
			}
		}, {
			"aliasColors": {
				"Max-Request-Duration": "#bf1b00"
			},
			"bars": false,
			"dashLength": 10,
			"dashes": false,
			"fill": 1,
			"gridPos": {
				"h": 9,
				"w": 8,
				"x": 8,
				"y": 20
			},
			"id": 4,
			"legend": {
				"avg": false,
				"current": false,
				"max": false,
				"min": false,
				"show": true,
				"total": false,
				"values": false
			},
			"lines": true,
			"linewidth": 1,
			"links": [],
			"nullPointMode": "connected",
			"percentage": false,
			"pointradius": 5,
			"points": false,
			"renderer": "flot",
			"seriesOverrides": [{
					"alias": "Max-Request-Duration",
					"yaxis": 2
				}, {
					"alias": "Max",
					"yaxis": 2
				}
			],
			"spaceLength": 10,
			"stack": false,
			"steppedLine": false,
			"targets": [{
					"expr": "sum(increase(grpc_server_processing_duration_seconds_sum[1m])) / sum(increase(grpc_server_processing_duration_seconds_count[1m]))",
					"format": "time_series",
					"hide": false,
					"interval": "1m",
					"intervalFactor": 1,
					"legendFormat": "Average",
					"refId": "A"
				}, {
					"expr": "max(grpc_server_processing_duration_seconds_max)",
					"format": "time_series",
					"hide": false,
					"interval": "1m",
					"intervalFactor": 1,
					"legendFormat": "Max",
					"refId": "B"
				}
			],
			"thresholds": [],
			"timeFrom": null,
			"timeRegions": [],
			"timeShift": null,
			"title": "Response Delay",
			"tooltip": {
				"shared": true,
				"sort": 0,
				"value_type": "individual"
			},
			"type": "graph",
			"xaxis": {
				"buckets": null,
				"mode": "time",
				"name": null,
				"show": true,
				"values": []
			},
			"yaxes": [{
					"format": "s",
					"label": null,
					"logBase": 1,
					"max": null,
					"min": "0",
					"show": true
				}, {
					"format": "s",
					"label": null,
					"logBase": 1,
					"max": null,
					"min": "0",
					"show": true
				}
			],
			"yaxis": {
				"align": false,
				"alignLevel": null
			}
		}, {
			"columns": [],
			"description": "The number of requests in the last hour",
			"fontSize": "100%",
			"gridPos": {
				"h": 9,
				"w": 8,
				"x": 16,
				"y": 20
			},
			"id": 6,
			"links": [],
			"pageSize": null,
			"scroll": true,
			"showHeader": true,
			"sort": {
				"col": null,
				"desc": false
			},
			"styles": [{
					"alias": "",
					"colorMode": null,
					"colors": [
						"rgba(245, 54, 54, 0.9)",
						"rgba(237, 129, 40, 0.89)",
						"rgba(50, 172, 45, 0.97)"
					],
					"dateFormat": "YYYY-MM-DD HH:mm:ss",
					"decimals": 2,
					"mappingType": 1,
					"pattern": "Time",
					"thresholds": [],
					"type": "hidden",
					"unit": "short"
				}, {
					"alias": "Service",
					"colorMode": null,
					"colors": [
						"rgba(245, 54, 54, 0.9)",
						"rgba(237, 129, 40, 0.89)",
						"rgba(50, 172, 45, 0.97)"
					],
					"dateFormat": "YYYY-MM-DD HH:mm:ss",
					"decimals": 2,
					"mappingType": 1,
					"pattern": "service",
					"thresholds": [],
					"type": "string",
					"unit": "short"
				}, {
					"alias": "Method",
					"colorMode": null,
					"colors": [
						"rgba(245, 54, 54, 0.9)",
						"rgba(237, 129, 40, 0.89)",
						"rgba(50, 172, 45, 0.97)"
					],
					"dateFormat": "YYYY-MM-DD HH:mm:ss",
					"decimals": 2,
					"mappingType": 1,
					"pattern": "method",
					"thresholds": [],
					"type": "string",
					"unit": "short"
				}, {
					"alias": "Last Hour",
					"colorMode": null,
					"colors": [
						"rgba(245, 54, 54, 0.9)",
						"rgba(237, 129, 40, 0.89)",
						"rgba(50, 172, 45, 0.97)"
					],
					"dateFormat": "YYYY-MM-DD HH:mm:ss",
					"decimals": 0,
					"mappingType": 1,
					"pattern": "Value #A",
					"thresholds": [],
					"type": "number",
					"unit": "short"
				}, {
					"alias": "Total",
					"colorMode": null,
					"colors": [
						"rgba(245, 54, 54, 0.9)",
						"rgba(237, 129, 40, 0.89)",
						"rgba(50, 172, 45, 0.97)"
					],
					"dateFormat": "YYYY-MM-DD HH:mm:ss",
					"decimals": 0,
					"mappingType": 1,
					"pattern": "Value #B",
					"thresholds": [],
					"type": "number",
					"unit": "short"
				}
			],
			"targets": [{
					"expr": "sort_desc(sum(increase(grpc_server_processing_duration_seconds_count[1h])) by (service, method))",
					"format": "table",
					"instant": true,
					"interval": "1h",
					"intervalFactor": 1,
					"legendFormat": "",
					"refId": "A"
				}, {
					"expr": "sort_desc(sum(grpc_server_processing_duration_seconds_count) by (service, method))",
					"format": "table",
					"instant": true,
					"intervalFactor": 1,
					"refId": "B"
				}
			],
			"title": "Request Overview",
			"transform": "table",
			"type": "table"
		}, {
			"aliasColors": {},
			"bars": false,
			"dashLength": 10,
			"dashes": false,
			"fill": 1,
			"gridPos": {
				"h": 9,
				"w": 12,
				"x": 0,
				"y": 29
			},
			"id": 8,
			"legend": {
				"avg": false,
				"current": false,
				"max": false,
				"min": false,
				"show": true,
				"total": false,
				"values": false
			},
			"lines": true,
			"linewidth": 1,
			"links": [],
			"nullPointMode": "null",
			"percentage": false,
			"pointradius": 5,
			"points": false,
			"renderer": "flot",
			"seriesOverrides": [],
			"spaceLength": 10,
			"stack": false,
			"steppedLine": false,
			"targets": [{
					"expr": "sum(increase(grpc_server_processing_duration_seconds_count[5m])) by (app)",
					"format": "time_series",
					"interval": "5m",
					"intervalFactor": 1,
					"legendFormat": "{{app}}",
					"refId": "A"
				}
			],
			"thresholds": [],
			"timeFrom": null,
			"timeRegions": [],
			"timeShift": null,
			"title": "Requests per App",
			"tooltip": {
				"shared": true,
				"sort": 0,
				"value_type": "individual"
			},
			"type": "graph",
			"xaxis": {
				"buckets": null,
				"mode": "time",
				"name": null,
				"show": true,
				"values": []
			},
			"yaxes": [{
					"decimals": 0,
					"format": "short",
					"label": null,
					"logBase": 1,
					"max": null,
					"min": "0",
					"show": true
				}, {
					"format": "short",
					"label": null,
					"logBase": 1,
					"max": null,
					"min": null,
					"show": false
				}
			],
			"yaxis": {
				"align": false,
				"alignLevel": null
			}
		}, {
			"aliasColors": {},
			"bars": false,
			"dashLength": 10,
			"dashes": false,
			"fill": 1,
			"gridPos": {
				"h": 9,
				"w": 12,
				"x": 12,
				"y": 29
			},
			"id": 20,
			"legend": {
				"avg": false,
				"current": false,
				"max": false,
				"min": false,
				"show": true,
				"total": false,
				"values": false
			},
			"lines": true,
			"linewidth": 1,
			"links": [],
			"nullPointMode": "null",
			"percentage": true,
			"pointradius": 5,
			"points": false,
			"renderer": "flot",
			"seriesOverrides": [],
			"spaceLength": 10,
			"stack": true,
			"steppedLine": false,
			"targets": [{
					"expr": "sum(increase(grpc_server_processing_duration_seconds_count[5m])) by (app)",
					"format": "time_series",
					"interval": "5m",
					"intervalFactor": 1,
					"legendFormat": "{{app}}",
					"refId": "A"
				}
			],
			"thresholds": [],
			"timeFrom": null,
			"timeRegions": [],
			"timeShift": null,
			"title": "Requests per App %",
			"tooltip": {
				"shared": true,
				"sort": 0,
				"value_type": "individual"
			},
			"type": "graph",
			"xaxis": {
				"buckets": null,
				"mode": "time",
				"name": null,
				"show": true,
				"values": []
			},
			"yaxes": [{
					"decimals": null,
					"format": "percent",
					"label": null,
					"logBase": 1,
					"max": "100",
					"min": "0",
					"show": true
				}, {
					"format": "short",
					"label": null,
					"logBase": 1,
					"max": null,
					"min": null,
					"show": false
				}
			],
			"yaxis": {
				"align": false,
				"alignLevel": null
			}
		}
	],
	"refresh": "30s",
	"schemaVersion": 18,
	"style": "dark",
	"tags": [
		"spring",
		"grpc",
		"java"
	],
	"templating": {
		"list": []
	},
	"time": {
		"from": "now-6h",
		"to": "now"
	},
	"timepicker": {
		"refresh_intervals": [
			"30s",
			"1m",
			"5m",
			"15m",
			"30m",
			"1h"
		],
		"time_options": [
			"5m",
			"15m",
			"1h",
			"6h",
			"12h",
			"24h",
			"2d",
			"7d",
			"30d"
		]
	},
	"timezone": "",
	"title": "GRPC-Services",
	"uid": "hrrAFy_mk",
	"version": 2
}
I'm curious, in your grpc-learning project, you exposed the io.grpc.MethodDescriptor.MethodType. Is there a special reason for exposing it, or do you just want to show it along with the grpc server/method names? Is having this tag/info important to you / should we consider exposing it as well?
I'm not counting request/response individually, but instead using the timer's in-built counter. Like you said before, there's no correlation between streaming request/response messages. Thus, I wanted to have visibility to the MethodType, so that I know what type of call it is. I can't say for sure if it's going to be useful for everyone, but I find it handy.
I will add this in 2.6.0 because it will take quite a bit of work to implement this feature properly.
Do you have a source for the comments mentioned in: https://github.com/asarkar/kotlin/blob/master/grpc-learning/src/main/kotlin/org/asarkar/greeting/server/GreetingServer.kt#L35 ?
Any suggestions for the following questions:
- How can we enable our users to specify their own event-loop groups + executors, that won't conflict with the metrics setup?
- Can I use the same event-loop-group / executor for all clients in an application or should I create one per channel?
- Are there any pages that explain best practises/production ready setups for grpc? Should I default to grpc's defaults and just wrap them with metrics?
Do you have a source for the comments
https://stackoverflow.com/a/42422045/839733
How can we enable our users to specify their own event-loop groups + executors, that won't conflict with the metrics setup?
Perhaps by providing an ExecutorService factory of some sort, like MonitoredExecutorService.
Can I use the same event-loop-group / executor for all clients in an application
I think this is a client decision. If there's a factory as suggested above, the client will have options.
Are there any pages that explain best practises/production ready setups for grpc?
I'm not aware of any, but I don't know everything. There are books and videos available in gRPC through https://learning.oreilly.com/.
I don't know enough about netty and their internals to decide on a reasonable default value. Netty internally has many parts that can be configured, but cannot be wrapped, so I won't add metrics support for the netty internals myself. Contributions welcome.
Things you have to pay attention to:
- epoll vs nio (event-loop-groups + channel-type)
- thread counts
- executor implementation
- netty + shaded netty
- retaining overwrite- and re-usability
I don't know if it makes sense to write metrics for the implementation details of Netty. It feels outside the scope of this project to me. Automatic collection of metrics around time for stub calls, sure, that could be an optional library.
Automatic collection of metrics around time for stub calls, sure, that could be an optional library.
I don't understand what you're referring to.
I don't understand what you're referring to.
Oh, I was thinking a new feature could be an optional/add-on to time calls through the stubs using spring-actuator's micrometer integration. I have some code that I've been trying to open source that wraps it in an easy way, that's why it came to mind.
I don't understand what you're referring to.
Oh, I was thinking a new feature could be an optional/add-on to time calls through the stubs using spring-actuator's micrometer integration. I have some code that I've been trying to open source that wraps it in an easy way, that's why it came to mind.
Sure go ahead. Maybe we could combine them with these ones.