carbon-c-relay
 carbon-c-relay copied to clipboard
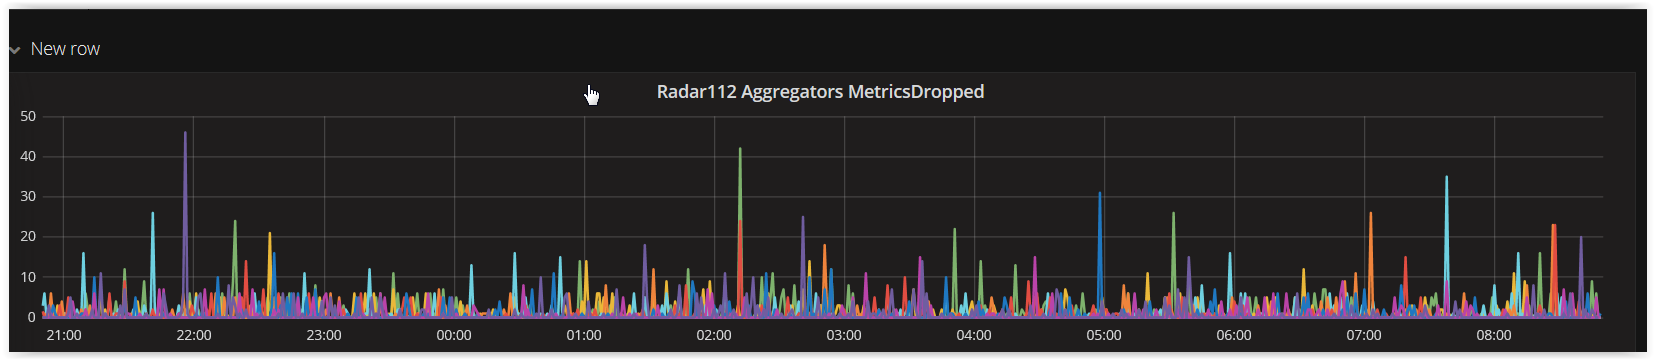
carbon.relays.zzz.aggregators.metricsDropped
At any given time, seeing a handful of metricsDropped from the aggregators. Is this normal, or should I realistically expect this to be 0? Is there something I should look at to find why these are being dropped?
I should add that I'm running carbon-c-relay thus: -q 400000 -B 4096 -U 16777216
The aggregator should in an ideal case not drop metrics. It records metrics to be dropped if:
- a metric was received with a timestamp too far in the past (you can increase the expire after for that)
- a metric was reveived too far in the future (expire might help a bit here too)
- the aggregator could not send an aggregate out, you will see a "aggregator: failed to write to" or "aggregator: uncomplete write on" error message in the logfile for that case (this usually indicates the relay is too busy, work is being done on trying to make this better)
I'm not seeing any "write" errors in the log. My expire is set to 90 seconds. Maybe I'll try increasing it.
I increased it to 100 and this had the immediate effect of dropping a lot more metrics. I reverted it back to 90. Maybe I'll try a lower value.
Our relay cluster (radar112) performs a first-stage aggregation. Its config file:
cluster radar122
  fnv1a_ch
    radar122-a.mgmt.xxxcom:1905=a
    radar122-b.mgmt.xxx.com:1905=b
... ;
match ^agg\. send to radar122 ;
match ^agg\. send to blackhole stop;
aggregate
    ^(.+)\.sum\.([^.]+)$
  every 60 seconds
  expire after 90 seconds
  timestamp at end of bucket
  compute sum write to agg.\1.sum_all.hosts
  ;
match * send to radar122;
radar122 is our backend cluster which performs second-stage aggregation and then writes it to carbon-cache. On the backend the relay process does a final-stage aggregation. Here is the config file:
cluster debug
  forward
    127.0.0.1:62001 proto udp
  ;
cluster cache
  fnv1a_ch
    127.0.0.1:2105=2105
    ....  ;

match * send to debug;
aggregate
    ^(us-east-1\.)?agg\.(.+)$
  every 60 seconds
  expire after 90 seconds
  timestamp at start of bucket
  compute sum write to \2
  ;
match ^agg\. send to blackhole stop;
match * send to cache stop;
A backend host collects the "agg" metrics arriving from different relay hosts, aggregates them again, and writes a new metric without "agg" in the name.
The relay layer shows dropped metrics, as seen in the graph I posted at the top of the thread.
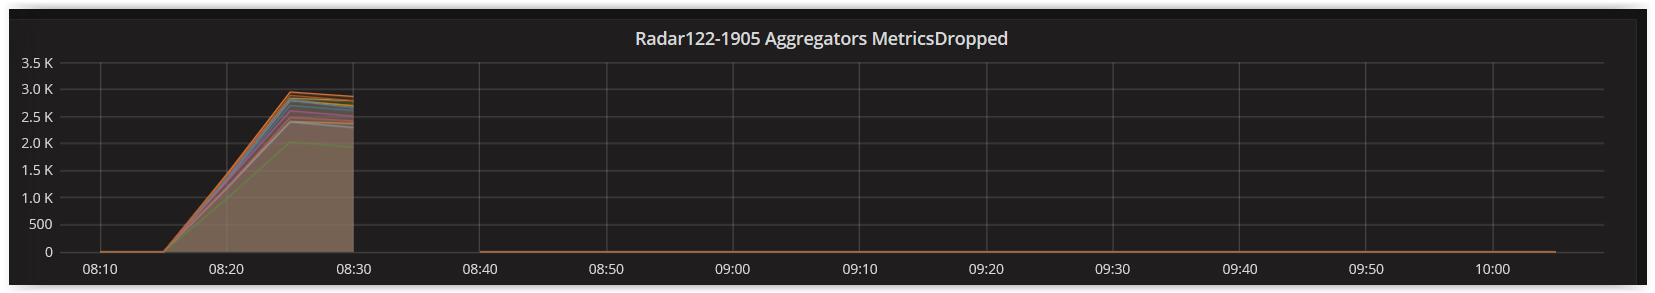
The backend does not drop any metrics, except yesterday when I increased expire from 90 to 100 on both clusters, then the backend relay started dropping on the order of 2.5K aggregators.metricsDropped / minute.
just an observation:
match ^agg\. send to radar122 ;
match ^agg\. send to blackhole stop;
this can be done in one statement:
match ^agg\. send to radar122 stop;
On which cluster did you increase the expiry time?
So in terms of busyness, how does the cpu-usage of the relay look like? I would be interested if you could test the latest master branch, it contains an aggregator fix/change that you might benefit from. It looks like its just too busy to handle everything.
CPU on our front end relay hosts (which only run carbon-c-relay) looks like this:
Linux 4.9.27-14.33.amzn1.x86_64 (ip-172-17-17-74)       07/20/2017      _x86_64_        (4 CPU)

01:34:44 AM  CPU    %usr   %nice    %sys %iowait    %irq   %soft  %steal  %guest   %idle
01:34:45 AM  all   18.63    0.00    5.59    0.00    0.00    0.62    2.17    0.00   72.98
01:34:46 AM  all   13.47    0.00    2.02    0.00    0.00    0.34    2.02    0.00   82.15
01:34:47 AM  all   14.29    0.00    2.60    0.00    0.00    0.97    1.95    0.00   80.19
Average:     all   15.53    0.00    3.45    0.00    0.00    0.65    2.05    0.00   78.32
On the backend relays (which also run carbon-cache and httpd) it looks like this:
Linux 4.4.35-33.55.amzn1.x86_64 (ip-172-17-35-135)      07/20/2017      _x86_64_        (8 CPU)

01:36:34 AM  CPU    %usr   %nice    %sys %iowait    %irq   %soft  %steal  %guest   %idle
01:36:35 AM  all   56.32    0.00   22.86    8.68    0.00    1.40    0.51    0.00   10.22
01:36:36 AM  all   61.68    0.00   23.87    5.16    0.00    1.29    0.26    0.00    7.74
01:36:37 AM  all   67.09    0.00   20.60    3.52    0.00    1.63    0.25    0.00    6.91
Average:     all   61.72    0.00   22.43    5.78    0.00    1.44    0.34    0.00    8.28
if you run the relay in "debug" mode (-d) you should get a message in the log about "aggregator: dropping metric too far in the future"
Unfortunately in this mode the internal statistics also go to stdout, so it's not that useful for running for a longer period of time. It does help to figure out which case the drops are for. Most probably it is the first case, the metrics arrive too late.
(90 + 60 / 60) + 2 = 4 buckets assigned for each metric. Your setting to 100 didn't add more capacity here. Setting it to 120 would, as you'd get 5 buckets. If the drops are really going up when increasing the expire after, I would like to understand why.
Now that I've resized our cluster, I'm coming back to take a look at this again.
I am seeing some (about 20/minute) dropped metrics of the following form:
@4000000059e0f5e010d4bd1c [2017-10-13 13:20:22] aggregator: dropping metric too far in the future (1507916110 > 1507915260): agg.brisk.system.cassandra-staging102.cassandra.compaction.system.size_estimates.sum_all.hosts from brisk.system.cassandra-staging102.cassandra.compaction.system.size_estimates.sum.ip-xxx_ec2_internal 4 1507916110
@4000000059e0fc3d2f4232ac [2017-10-13 13:47:31] aggregator: dropping metric too far in the future (1507917385 > 1507916940): agg.brisk.system.gc.ParNew.count.cassandra-staging102.sum_all.hosts from brisk.system.gc.ParNew.count.cassandra-staging102.sum.ip-xxx_ec2_internal 2 1507917385
@4000000059e0fc3d2f429454 [2017-10-13 13:47:31] aggregator: dropping metric too far in the future (1507917385 > 1507916940): agg.brisk.system.gc.ParNew.time.cassandra-staging102.sum_all.hosts from brisk.system.gc.ParNew.time.cassandra-staging102.sum.ip-xxx_ec2_internal 426 1507917385
Should I increase expire to 120, or is there something else I should do first?
That's 14 minutes (!) ahead. Are the clocks synced? The timestamps that is reported as exceeded is translated to human time matching the log record time, which seems to suggest the aggregator may be a tad bit behind, but not 14 minutes. It could be a valid scenario where the sender indeed is sending messages about the future. Increasing the expiry is going to be insanely high in order to match a 15 minute window IMO.
I'm also seeing this issue, although I am getting no warnings in the debug logs. Here are all I get:
[2017-11-22 16:22:19] _collector_stub_0xa36d50__carbon.relays.ip-10-0-219-84.aggregators.metricsReceived 601624 1511367739
[2017-11-22 16:22:19] _collector_stub_0xa36d50__carbon.relays.ip-10-0-219-84.aggregators.metricsSent 0 1511367739
[2017-11-22 16:22:19] _collector_stub_0xa36d50__carbon.relays.ip-10-0-219-84.aggregators.metricsDropped 1202722 1511367739
It looks like at any given time 2 CPUs (out of 8 total) are completely pegged while the remaining 6 are mostly idle. I suspect this is due to having too many aggregation rules in place, although I am testing with a smaller subset of our rules. When I have a single rule in place things work as expected.
When I have multiple rules in place there is an initial burst of aggregations being persisted to our backend, but pretty quickly after carbon-c-relay starts up they drop off and I see the metricsDropped shoot up. It stays this way until we restart the carbon-c-relay process.
Here's our test config, which only has the smaller subset of aggregations: https://gist.github.com/poblahblahblah/ce2819a9556bef589b3f3e34eb1178a6
Thanks for keeping this thread alive. I still need to keep looking into it more on my end, but I haven't had time recently. We do a large number of aggregations; the aggregated metrics are important for our business. I set up some monitoring to let me know when our sum values get out of sync from (lower than) what they should be. This happens pretty frequently by several million. I still need to find time to investigate this.
@grobian I made sure the linux system time on our graphite clients is in sync with the aggregator hosts.