mission-control-indexer
 mission-control-indexer copied to clipboard
Failed to process trigger in block | Ethereum head_block_number thrown into future
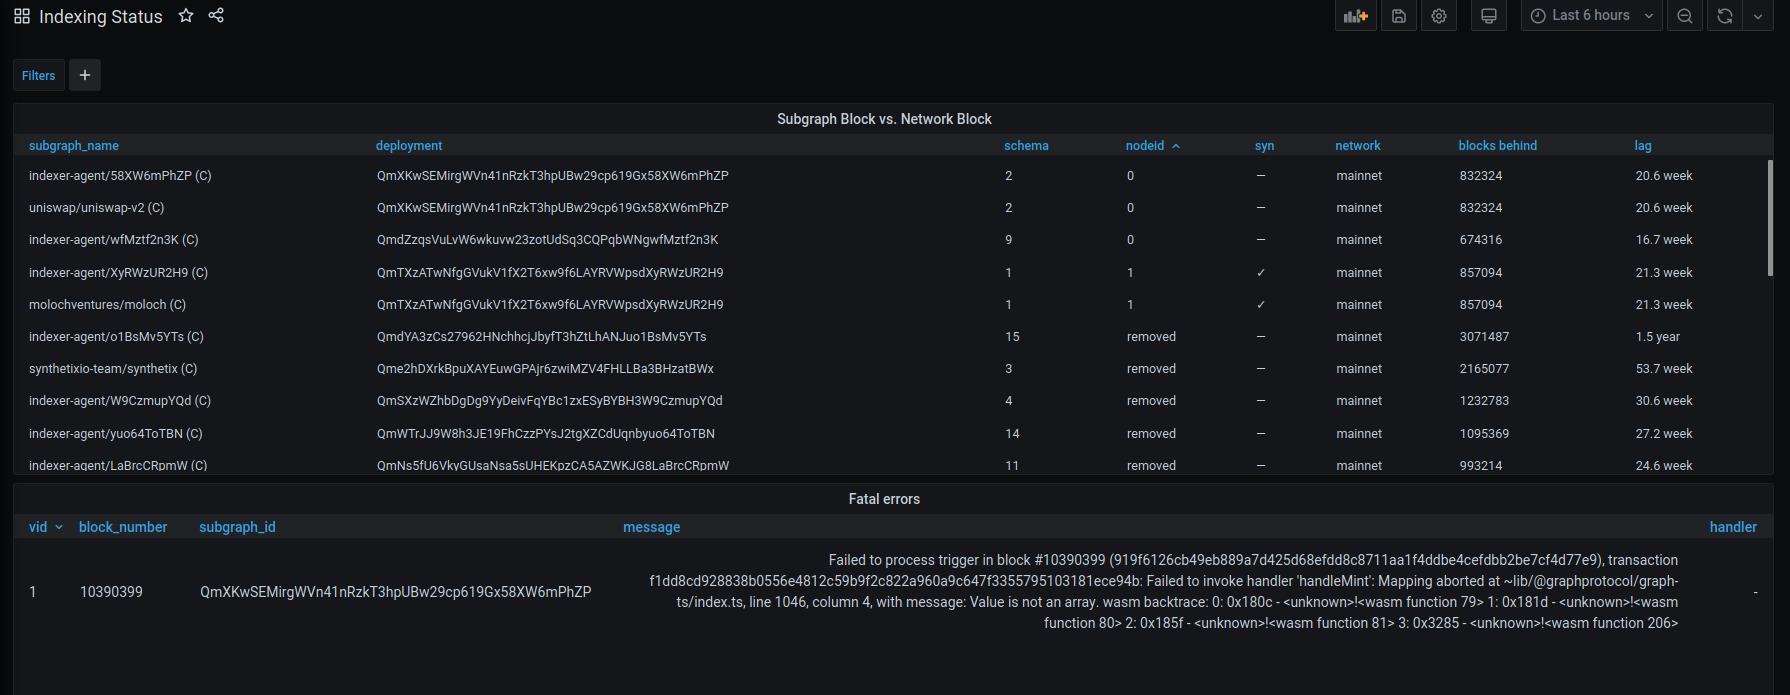
On my grafana dashboard I still see this issue which confuses many Prometheus metrics:
Failed to process trigger in block #10390399 (919f6126cb49eb889a7d425d68efdd8c8711aa1f4ddbe4cefdbb2be7cf4d77e9), transaction f1dd8cd928838b0556e4812c59b9f2c822a960a9c647f3355795103181ece94b: Failed to invoke handler 'handleMint': Mapping aborted at ~lib/@graphprotocol/graph-ts/index.ts, line 1046, column 4, with message: Value is not an array. wasm backtrace: 0: 0x180c - <unknown>!<wasm function 79> 1: 0x181d - <unknown>!<wasm function 80> 2: 0x185f - <unknown>!<wasm function 81> 3: 0x3285 - <unknown>!<wasm function 206>
I heard that internally the error is known. Is there a solution in the meantime? I will gladly provide you with further details as well.
So far I have tried to solve the problem by deleting this ETH block and the following ones within the Postgres DB. Unfortunately, I did not succeed.
The only workaround for me was to reboot the system whenever this fatal error triggered. After that it continued indexing.
Mine is still indexing but the error is still there. That causes somehow weird prometheus metrics.
 And how can i fix this broken metrics? I mean being synced and being blocks behind doesnt make sense.
I refer to moloch. Not only the metrics of the subgraph with the error are broken, probably several.
How long have you been waiting for it to sync after restart? Maybe you did something when you tried to tinker with the database, like you mentioned in the OP
Well. Just looked again into molochs logs and seeing this now:
Sep 19 13:24:31.383 DEBG Block stream produced a non-fatal error, error: Compat { error: ErrorMessage { msg: "Ethereum node did not find block 0x758eab290a578f390c35cc616c51ab94a5a32e67ebc83cbf58d906f03fa8b0ae" } }, subgraph_id: QmTXzATwNfgGVukV1fX2T6xw9f6LAYRVWpsdXyRWzUR2H9, component: SubgraphInstanceManager
Sep 19 13:26:31.394 DEBG Requesting 1 block(s), subgraph_id: QmTXzATwNfgGVukV1fX2T6xw9f6LAYRVWpsdXyRWzUR2H9, component: SubgraphInstanceManager > BlockStream
Sep 19 13:26:31.621 DEBG Trying again after load block 0x758e…b0ae failed (attempt #1) with result Err(Compat { error: ErrorMessage { msg: "Ethereum node did not find block 0x758eab290a578f390c35cc616c51ab94a5a32e67ebc83cbf58d906f03fa8b0ae" } }), subgraph_id: QmTXzATwNfgGVukV1fX2T6xw9f6LAYRVWpsdXyRWzUR2H9, component: SubgraphInstanceManager > BlockStream
Sep 19 13:26:31.739 DEBG Trying again after load block 0x758e…b0ae failed (attempt #2) with result Err(Compat { error: ErrorMessage { msg: "Ethereum node did not find block 0x758eab290a578f390c35cc616c51ab94a5a32e67ebc83cbf58d906f03fa8b0ae" } }), subgraph_id: QmTXzATwNfgGVukV1fX2T6xw9f6LAYRVWpsdXyRWzUR2H9, component: SubgraphInstanceManager > BlockStream
Sep 19 13:26:31.858 DEBG Trying again after load block 0x758e…b0ae failed (attempt #3) with result Err(Compat { error: ErrorMessage { msg: "Ethereum node did not find block 0x758eab290a578f390c35cc616c51ab94a5a32e67ebc83cbf58d906f03fa8b0ae" } }), subgraph_id: QmTXzATwNfgGVukV1fX2T6xw9f6LAYRVWpsdXyRWzUR2H9, component: SubgraphInstanceManager > BlockStream
Sep 19 13:26:31.980 DEBG Trying again after load block 0x758e…b0ae failed (attempt #4) with result Err(Compat { error: ErrorMessage { msg: "Ethereum node did not find block 0x758eab290a578f390c35cc616c51ab94a5a32e67ebc83cbf58d906f03fa8b0ae" } }), subgraph_id: QmTXzATwNfgGVukV1fX2T6xw9f6LAYRVWpsdXyRWzUR2H9, component: SubgraphInstanceManager > BlockStream
Sep 19 13:26:32.098 DEBG Trying again after load block 0x758e…b0ae failed (attempt #5) with result Err(Compat { error: ErrorMessage { msg: "Ethereum node did not find block 0x758eab290a578f390c35cc616c51ab94a5a32e67ebc83cbf58d906f03fa8b0ae" } }), subgraph_id: QmTXzATwNfgGVukV1fX2T6xw9f6LAYRVWpsdXyRWzUR2H9, component: SubgraphInstanceManager > BlockStream
Sep 19 13:26:32.238 DEBG Trying again after load block 0x758e…b0ae failed (attempt #6) with result Err(Compat { error: ErrorMessage { msg: "Ethereum node did not find block 0x758eab290a578f390c35cc616c51ab94a5a32e67ebc83cbf58d906f03fa8b0ae" } }), subgraph_id: QmTXzATwNfgGVukV1fX2T6xw9f6LAYRVWpsdXyRWzUR2H9, component: SubgraphInstanceManager > BlockStream
Sep 19 13:26:32.376 DEBG Trying again after load block 0x758e…b0ae failed (attempt #7) with result Err(Compat { error: ErrorMessage { msg: "Ethereum node did not find block 0x758eab290a578f390c35cc616c51ab94a5a32e67ebc83cbf58d906f03fa8b0ae" } }), subgraph_id: QmTXzATwNfgGVukV1fX2T6xw9f6LAYRVWpsdXyRWzUR2H9, component: SubgraphInstanceManager > BlockStream
Sep 19 13:26:32.586 DEBG Trying again after load block 0x758e…b0ae failed (attempt #8) with result Err(Compat { error: ErrorMessage { msg: "Ethereum node did not find block 0x758eab290a578f390c35cc616c51ab94a5a32e67ebc83cbf58d906f03fa8b0ae" } }), subgraph_id: QmTXzATwNfgGVukV1fX2T6xw9f6LAYRVWpsdXyRWzUR2H9, component: SubgraphInstanceManager > BlockStream
Sep 19 13:26:32.780 DEBG Trying again after load block 0x758e…b0ae failed (attempt #9) with result Err(Compat { error: ErrorMessage { msg: "Ethereum node did not find block 0x758eab290a578f390c35cc616c51ab94a5a32e67ebc83cbf58d906f03fa8b0ae" } }), subgraph_id: QmTXzATwNfgGVukV1fX2T6xw9f6LAYRVWpsdXyRWzUR2H9, component: SubgraphInstanceManager > BlockStream
Sep 19 13:26:32.989 WARN Trying again after load block 0x758e…b0ae failed (attempt #10) with result Err(Compat { error: ErrorMessage { msg: "Ethereum node did not find block 0x758eab290a578f390c35cc616c51ab94a5a32e67ebc83cbf58d906f03fa8b0ae" } }), subgraph_id: QmTXzATwNfgGVukV1fX2T6xw9f6LAYRVWpsdXyRWzUR2H9, component: SubgraphInstanceManager > BlockStream
Sep 19 13:26:32.990 DEBG Block stream produced a non-fatal error, error: Compat { error: ErrorMessage { msg: "Ethereum node did not find block 0x758eab290a578f390c35cc616c51ab94a5a32e67ebc83cbf58d906f03fa8b0ae" } }, subgraph_id: QmTXzATwNfgGVukV1fX2T6xw9f6LAYRVWpsdXyRWzUR2H9, component: SubgraphInstanceManager
However Uniswap still keeps indexing.
Now I tried something else again. I started indexing the Tellor subgraph (QmbBHyLRN97BssF7w6MnULW92f7iaM7vX7fnNU6wDDj3fc).
It was in a very short time (2h) at the highest Ethereum mainnet block according to the index-node logs.
Sep 21 22:03:17.948 INFO Scanning blocks [10907886, 10908885], range_size: 1000, subgraph_id: QmbBHyLRN97BssF7w6MnULW92f7iaM7vX7fnNU6wDDj3fc, component: SubgraphInstanceManager > BlockStream
Sep 21 22:03:17.950 DEBG Requesting logs for blocks [10907886, 10908885], contract 0x0ba45a8b5d5575935b8158a88c631e9f9c95a2e5, 7 events, subgraph_id: QmbBHyLRN97BssF7w6MnULW92f7iaM7vX7fnNU6wDDj3fc, component: SubgraphInstanceManager > BlockStream
Sep 21 22:03:18.174 DEBG Reducing block range size to scan for events, new_size: 100, subgraph_id: QmbBHyLRN97BssF7w6MnULW92f7iaM7vX7fnNU6wDDj3fc, component: SubgraphInstanceManager > BlockStream
Sep 21 22:03:18.174 DEBG Requesting logs for blocks [10907886, 10907985], contract 0x0ba45a8b5d5575935b8158a88c631e9f9c95a2e5, 7 events, subgraph_id: QmbBHyLRN97BssF7w6MnULW92f7iaM7vX7fnNU6wDDj3fc, component: SubgraphInstanceManager > BlockStream
Sep 21 22:03:18.175 WARN Failed to fetch block hash for block number, number: 10908885, subgraph_id: QmbBHyLRN97BssF7w6MnULW92f7iaM7vX7fnNU6wDDj3fc, component: SubgraphInstanceManager > BlockStream
Sep 21 22:03:18.175 WARN Ethereum endpoint is behind, url: 168.119.1.79, subgraph_id: QmbBHyLRN97BssF7w6MnULW92f7iaM7vX7fnNU6wDDj3fc, component: SubgraphInstanceManager > BlockStream
Sep 21 22:03:18.175 DEBG Block stream produced a non-fatal error, error: Block 10908885 not found in the chain, subgraph_id: QmbBHyLRN97BssF7w6MnULW92f7iaM7vX7fnNU6wDDj3fc, component: SubgraphInstanceManager
But the Prometheus metrics and grafana still show that I would be many blocks behind.
http://34.120.160.19/prometheus/graph?g0.range_input=1h&g0.expr=deployment_blocks_behind&g0.tab=1&g1.range_input=1h&g1.expr=&g1.tab=1

I would now make the following assumptions.
- A variable may have overflowed and the calculation now shows a wrong value.
- There is something damaged in the database, so the calculations are not correct.
- The indexer starts indexing further ahead and ignores the front blocks.
But what else came to my mind. The original error could have occurred after I had changed something at the ethereum nodes. I removed the rinkeby endpoint and switched from Quicknode to OpenEthereum. Immediately after the error occurred, the metrics were corrupted. The tinkering in the database took place afterwards and did not cause any changes.
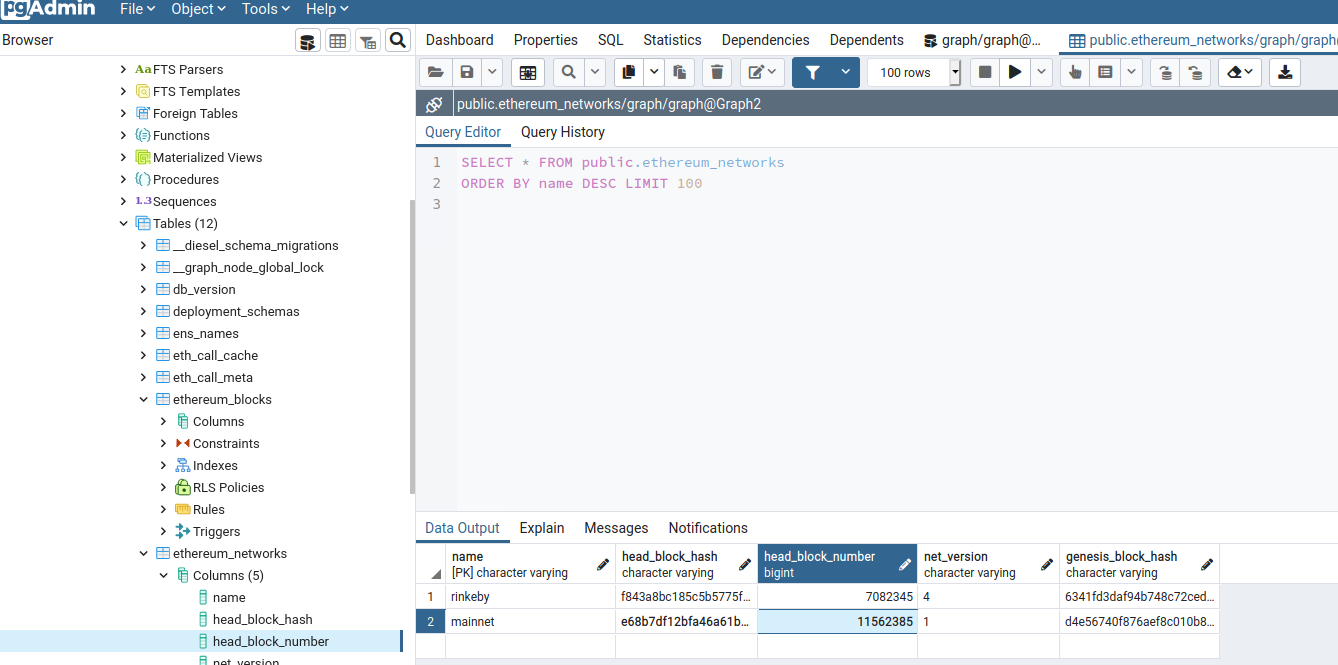
Ok. Might have found the issue.
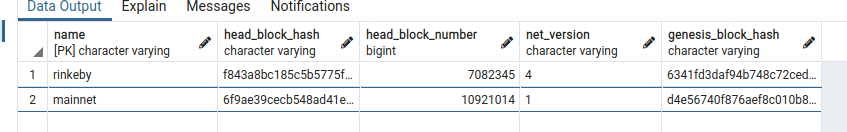
head_block_number = 11562385 Real head block = 10908596 11562385 - 10908596 = 653789 This comes pretty close to my strange block behind numbers.
How could this happen? Does the database increment this value itself?
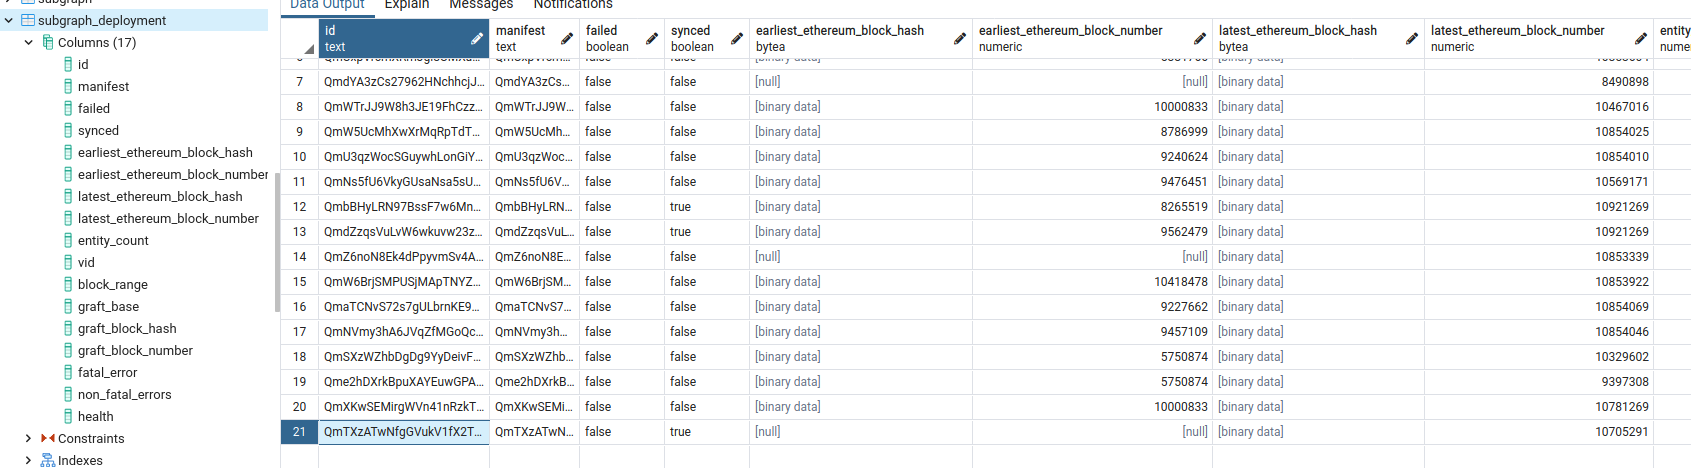
Postgres tinkering part 2
As expected. There is an entry inside the database with a block in the future.
11562385 - e68b7df12bfa46a61b1af421698c887098cdcfe52e16e195153d7922fe880b94
So lets change this to a recent mined block.
10920940 - 1b0467d32f50e3657ab233c1367c091897dee8008bbf3b3584ed2004d336b1ce
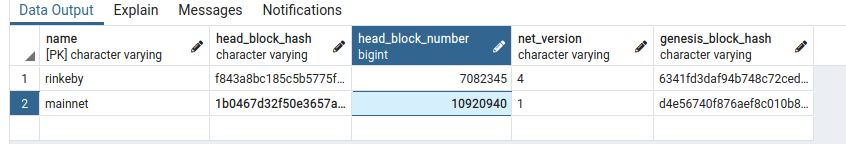
Upload, restart indexer and pray....
Well ... looks good. :+1: Now its refreshing to the latest block itself.
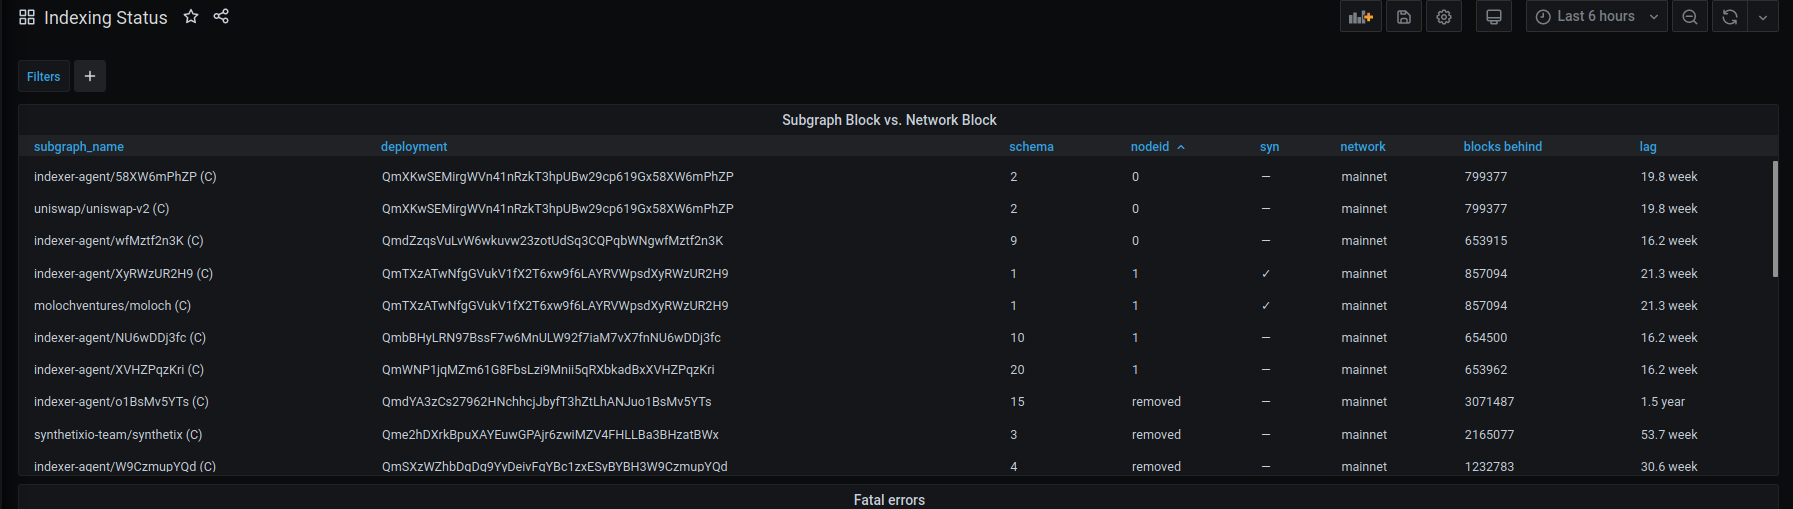
Lets have a look to grafana.
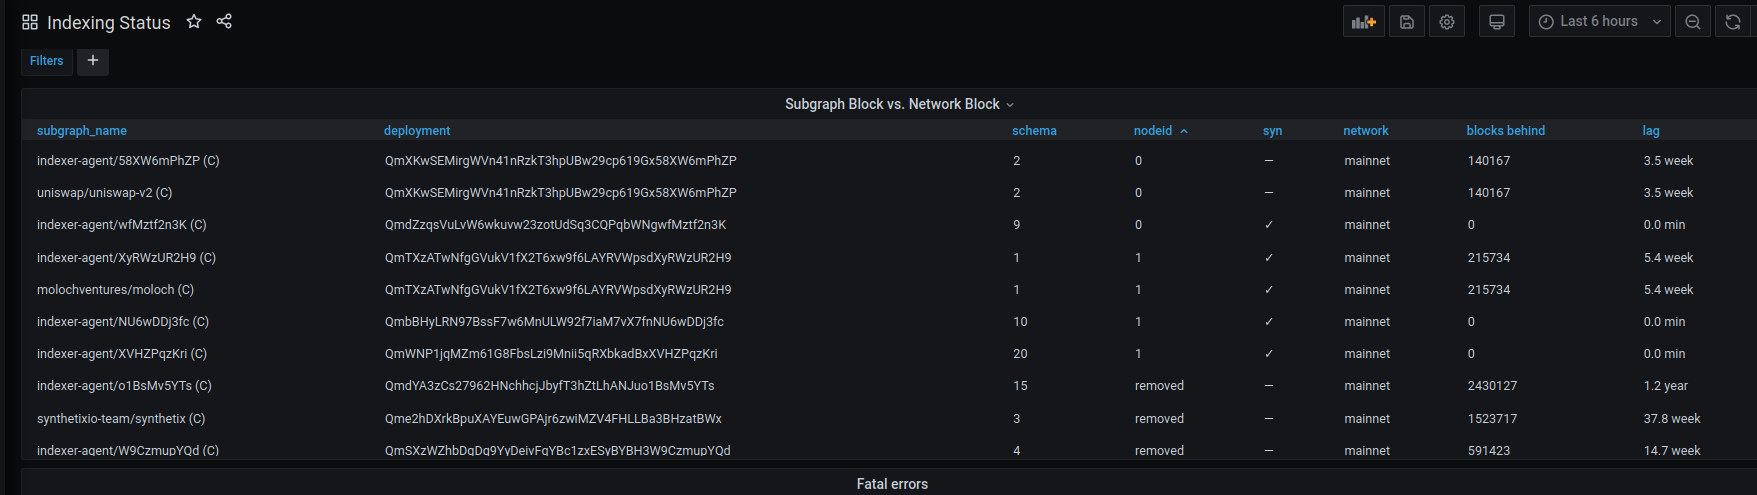
Looking quite good. All recent added subgraphs are sync! :partying_face: Only Moloch has some trouble and uniswap ... well, stays slow.
So index node 0 is fine.
Lets look into index node 1 and moloch.
Sep 23 20:36:36.872 INFO Applying 7 entity operation(s), block_hash: 0x50c503a677886e92ebd339a1201c1f2b67651b3268a8ce2322bcb82acb3cc3dc, block_number: 10921025, subgraph_id: QmWNP1jqMZm61G8FbsLzi9Mnii5qRXbkadBxXVHZPqzKri, component: SubgraphInstanceManager
Sep 23 20:37:56.226 DEBG Requesting 1 block(s), subgraph_id: QmTXzATwNfgGVukV1fX2T6xw9f6LAYRVWpsdXyRWzUR2H9, component: SubgraphInstanceManager > BlockStream
Sep 23 20:37:56.446 DEBG Trying again after load block 0x758e…b0ae failed (attempt #1) with result Err(Compat { error: ErrorMessage { msg: "Ethereum node did not find block 0x758eab290a578f390c35cc616c51ab94a5a32e67ebc83cbf58d906f03fa8b0ae" } }), subgraph_id: QmTXzATwNfgGVukV1fX2T6xw9f6LAYRVWpsdXyRWzUR2H9, component: SubgraphInstanceManager > BlockStream
Sep 23 20:37:56.558 DEBG Trying again after load block 0x758e…b0ae failed (attempt #2) with result Err(Compat { error: ErrorMessage { msg: "Ethereum node did not find block 0x758eab290a578f390c35cc616c51ab94a5a32e67ebc83cbf58d906f03fa8b0ae" } }), subgraph_id: QmTXzATwNfgGVukV1fX2T6xw9f6LAYRVWpsdXyRWzUR2H9, component: SubgraphInstanceManager > BlockStream
Sep 23 20:37:56.671 DEBG Trying again after load block 0x758e…b0ae failed (attempt #3) with result Err(Compat { error: ErrorMessage { msg: "Ethereum node did not find block 0x758eab290a578f390c35cc616c51ab94a5a32e67ebc83cbf58d906f03fa8b0ae" } }), subgraph_id: QmTXzATwNfgGVukV1fX2T6xw9f6LAYRVWpsdXyRWzUR2H9, component: SubgraphInstanceManager > BlockStream
Sep 23 20:37:56.786 DEBG Trying again after load block 0x758e…b0ae failed (attempt #4) with result Err(Compat { error: ErrorMessage { msg: "Ethereum node did not find block 0x758eab290a578f390c35cc616c51ab94a5a32e67ebc83cbf58d906f03fa8b0ae" } }), subgraph_id: QmTXzATwNfgGVukV1fX2T6xw9f6LAYRVWpsdXyRWzUR2H9, component: SubgraphInstanceManager > BlockStream
Sep 23 20:37:56.898 DEBG Trying again after load block 0x758e…b0ae failed (attempt #5) with result Err(Compat { error: ErrorMessage { msg: "Ethereum node did not find block 0x758eab290a578f390c35cc616c51ab94a5a32e67ebc83cbf58d906f03fa8b0ae" } }), subgraph_id: QmTXzATwNfgGVukV1fX2T6xw9f6LAYRVWpsdXyRWzUR2H9, component: SubgraphInstanceManager > BlockStream
Sep 23 20:37:57.014 DEBG Trying again after load block 0x758e…b0ae failed (attempt #6) with result Err(Compat { error: ErrorMessage { msg: "Ethereum node did not find block 0x758eab290a578f390c35cc616c51ab94a5a32e67ebc83cbf58d906f03fa8b0ae" } }), subgraph_id: QmTXzATwNfgGVukV1fX2T6xw9f6LAYRVWpsdXyRWzUR2H9, component: SubgraphInstanceManager > BlockStream
Sep 23 20:37:57.188 DEBG Trying again after load block 0x758e…b0ae failed (attempt #7) with result Err(Compat { error: ErrorMessage { msg: "Ethereum node did not find block 0x758eab290a578f390c35cc616c51ab94a5a32e67ebc83cbf58d906f03fa8b0ae" } }), subgraph_id: QmTXzATwNfgGVukV1fX2T6xw9f6LAYRVWpsdXyRWzUR2H9, component: SubgraphInstanceManager > BlockStream
Sep 23 20:37:57.412 DEBG Trying again after load block 0x758e…b0ae failed (attempt #8) with result Err(Compat { error: ErrorMessage { msg: "Ethereum node did not find block 0x758eab290a578f390c35cc616c51ab94a5a32e67ebc83cbf58d906f03fa8b0ae" } }), subgraph_id: QmTXzATwNfgGVukV1fX2T6xw9f6LAYRVWpsdXyRWzUR2H9, component: SubgraphInstanceManager > BlockStream
Sep 23 20:37:57.657 DEBG Trying again after load block 0x758e…b0ae failed (attempt #9) with result Err(Compat { error: ErrorMessage { msg: "Ethereum node did not find block 0x758eab290a578f390c35cc616c51ab94a5a32e67ebc83cbf58d906f03fa8b0ae" } }), subgraph_id: QmTXzATwNfgGVukV1fX2T6xw9f6LAYRVWpsdXyRWzUR2H9, component: SubgraphInstanceManager > BlockStream
Sep 23 20:37:58.071 WARN Trying again after load block 0x758e…b0ae failed (attempt #10) with result Err(Compat { error: ErrorMessage { msg: "Ethereum node did not find block 0x758eab290a578f390c35cc616c51ab94a5a32e67ebc83cbf58d906f03fa8b0ae" } }), subgraph_id: QmTXzATwNfgGVukV1fX2T6xw9f6LAYRVWpsdXyRWzUR2H9, component: SubgraphInstanceManager > BlockStream
Sep 23 20:37:58.071 DEBG Block stream produced a non-fatal error, error: Compat { error: ErrorMessage { msg: "Ethereum node did not find block 0x758eab290a578f390c35cc616c51ab94a5a32e67ebc83cbf58d906f03fa8b0ae" } }, subgraph_id: QmTXzATwNfgGVukV1fX2T6xw9f6LAYRVWpsdXyRWzUR2H9, component: SubgraphInstanceManager
He wants block 0x758eab290a578f390c35cc616c51ab94a5a32e67ebc83cbf58d906f03fa8b0ae. I guess he is meaning the hash of that block. Neither etherscan nor my not comprehensive db querys can find that hash. Anyone has an idea where to search and fix that issue? What I found so far is that moloch and some other subgraphs (not indexing right now) have no earliest block.
But the much more interesting question:
How did it happen that my ethereum head block was thrown into the future?
Who writes that value? Did a ethereum node played a bad joke on me? Should this value be validated?
I just wanted to add, I too have seen this issue with the head_block_number somehow ending up being a block way in to the future. Manually altering the value in the database has got the graph node processing again, though it has had the side effect of showing the moloch subgraph (QmTXzATwNfgGVukV1fX2T6xw9f6LAYRVWpsdXyRWzUR2H9), which was fully synced, as now being a negative number of blocks and weeks behind