pygraphistry
 pygraphistry copied to clipboard
Published
20 hours ago •
 graphistry
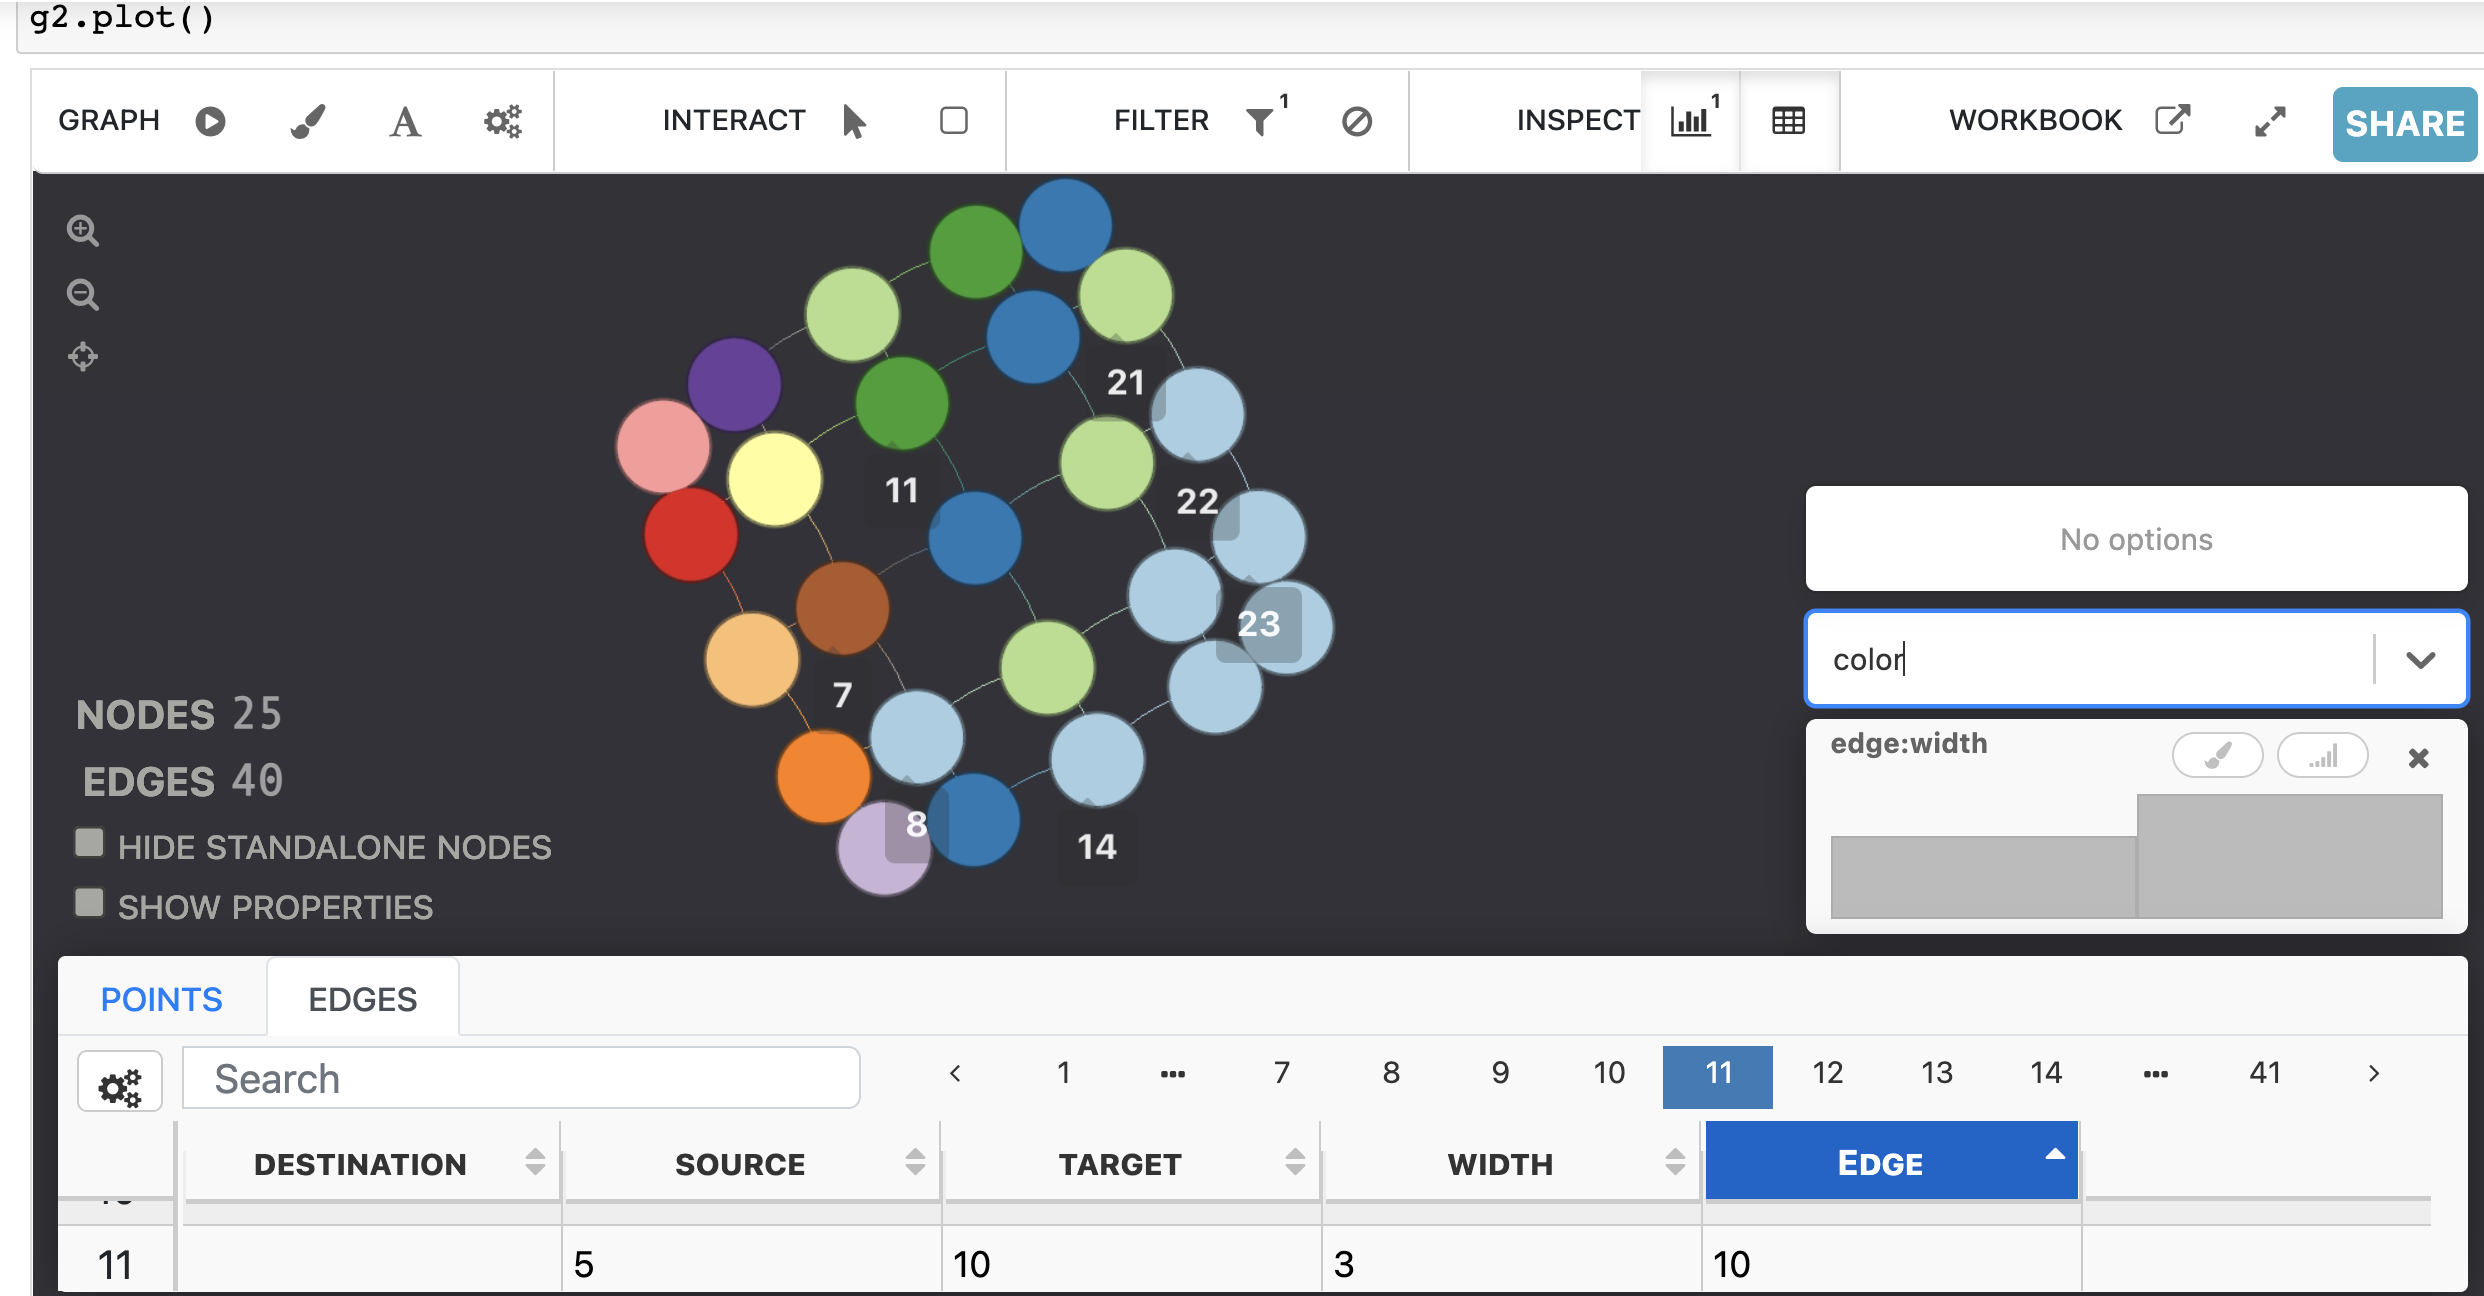
[BUG] plot missing edge column `color`
Describe the bug plot data/histogram does not match nodes and edges dataframe
To Reproduce
import pandas as pd
import graphistry
#graphistry.register(api=3, username='...', password='...')

# example taken from https://igraph.org/python/versions/0.10.1/tutorials/minimum_spanning_trees/minimum_spanning_trees.html
import random
import igraph as ig
import matplotlib.pyplot as plt

# Generate grid graph with random weights
random.seed(0)

g = ig.Graph.Lattice([5, 5], circular=False)
g.es["weight"] = [random.randint(1, 20) for _ in g.es]
spanning_tree = g.spanning_tree(weights=None, return_tree=False)

g.es["color"] = "lightgray"
g.es[spanning_tree]["color"] = "midnightblue"
g.es["width"] = 0.5
g.es[spanning_tree]["width"] = 3.0

g2 = graphistry.bind()
g2 = g2.from_igraph(g)

assert 'color' in g2._edges # TRUE

g2.plot() # -> produces correct graph, but in edge table of UI as well as histogram, it is missing `color` attribute
Screenshots
Browser environment (please complete the following information):
- OS: [OSX]
- Browser [Brave]
- Version Version 1.45.123 Chromium: 107.0.5304.110 (Official Build) (x86_64)]
Graphistry GPU server environment
- Where run [Hub]
PyGraphistry API client environment
- Where run [Graphistry Jupyter]
- Version [0.28.7]
- Python Version [e.g. Python 3.8]