Store-gateway: Series() response latency impacted by Send() more than I expected
While investigating https://github.com/grafana/mimir/issues/3940 I noticed that the store-gateway Series() response latency is impacted by the Send() more than I expected.
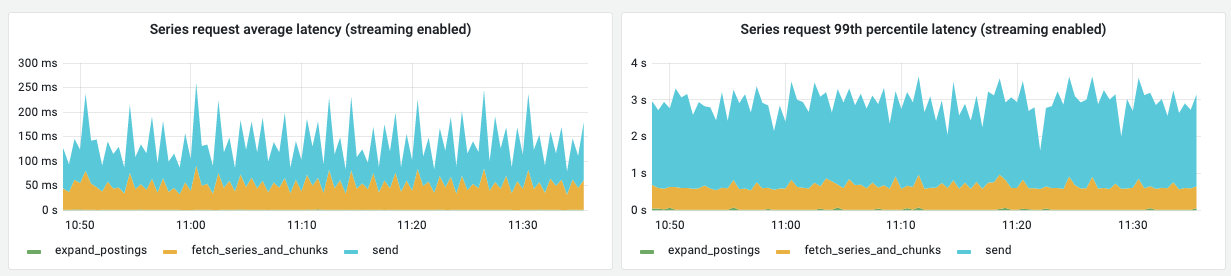
The following screenshot shows the breakdown of Series() latency in a test cluster when streaming store-gateway is enabled (we haven't rolled out the new metric to production, so we don't have the measurement in real clusters yet):
In this issue I will write down notes about my investigation.
How the store-gateway send Series() response to the client (querier)
The store-gateway Series() gRPC endpoint is based on a stream. Each message sent on the gRPC stream contains a single series (code):
type SeriesResponse_Series struct {
	Series *Series `protobuf:"bytes,1,opt,name=series,proto3,oneof"`
}
In case of high cardinality query (my load testing generates responses between 50k and 100k series) the store-gateway will call Send() many times, one for each series to send (code):
srv.Send(storepb.NewSeriesResponse(&series))
Theory: HTTP2 flow control
What is flow control
gRPC is based on HTTP2, and HTTP2 has a flow control mechanism. The flow control is based on a window size, which is the number of unacknowledged bytes the sender can send to the client. The flow control is applied both at the HTTP2 connection level, and at a per-stream level (a connection can have multiple streams).
The receiver decides the window size and communicates it to the sender. Since gRPC is bidirectional, both client and server communicate their window size to the other end. The default window size in golang gRPC is (64 * 1024) - 1 = 65535 bytes, but golang gRPC implements an algorithm based on "Bandwidth Delay Product" to estimate the network bandwidth and so the window size gets adjusted as soon as some data begins to flow over the connection. BDP estimator runs continuously, so continuously adjust the window size.
BDP estimator is enabled by default, but gets automatically disabled as soon as you set an explicit window size either on the connection and/or the stream:
// Sets the window size on the gRPC connection.
opts = append(opts, grpc.WithInitialWindowSize(<value>))

// Sets the window size for each gRPC stream that will be created over the connection.
opts = append(opts, grpc.WithInitialConnWindowSize(<value>))
The received bytes are not acknowledged by the receiver for every single frame received, but only once the unacknowledged bytes are >= 1/4 of the window size. For example, if the window size is 64KB, then the receiver will send a WINDOW_UPDATE frame to the sender once the receiver has received and not yet acknowledged at least 64KB / 4 = 16KB.
The window update frame will contain the number of bytes to acknowledge. The sender decreases the window size each time some data frames are sent to the receiver, then once it receives a WINDOW_UPDATE frame it will increase the window size by the number of bytes specified in the window update frame itself.
Example of flow control
- S: sender
- R: receiver
- Initial window size: 64KB
- For simplicity, let's assume BDP estimator is disabled, so the window size is fixed to 64KB
# S outgoing window size: 64KB
S -> sends data frame of 4 KB -> R
# S outgoing window size: 60KB
S -> sends data frame of 8 KB -> R
# S outgoing window size: 52KB
S -> sends data frame of 8 KB -> R
# S outgoing window size: 44KB
R -> sends window update for 20KB -> S
# S outgoing window size: 64KB
References
Why the window size may matter?
There's a network between sender and receiver, and the receiver may also be "slow" (e.g. high CPU or even the GC running) and so slightly slow to receive messages (at application level) and thus slightly slow to send the window update. If we send a large number of messages over the gRPC stream (e.g. 50k messages for a query with 50k series cardinality) then we may end up in the following situation:
# S outgoing window size: 64KB

Repeat for 16 times:
  S -> sends a message of 4KB -> R

# S outgoing window size: 0KB

R -> sends window update for 64KB -> S

# S outgoing window size: 64KB

Repeat for 16 times:
  S -> sends a message of 4KB -> R

# ... and so on ...
Sending a message has also a CPU cost on the sender side. Whenever we call Send(), the message needs to be marshalled first and then written to the connection. If the window update frame from the receiver arrives to the sender after the window size has already been exausted, the sender will pause and then continue only after the window update frame is received, thus introducing a delay on the sender side as well (in the meanwhile it could have prepared more messages to be sent, marshalling them in advance, but that's not how the code works).
Experimentation
To learn more how the flow control works and to experiment with that, I've built a simple client-server application (code) implementing the store-gateway gRPC API. This application sends 50k series with 4KB chunks each. The client just receive them. Both client and server run locally (separate processes).
Test results, showing the average per-request latency running 50 requests:
| Window size | Concurrency = 1 | Concurrency = 2 | Concurrency = 4 | Concurrency = 8 |
|---|---|---|---|---|
| Dynamic (default) | 1.39s | 709ms | 1.12s | 1.97s |
| 64 KB | 554 ms | 1.12s | 2.31s | 4.51s |
| 256 KB | 704ms | 816ms | 1.13s | 2.83s |
| 512 KB | 1.05s | 841ms | 1.52s | 2.30s |
| 1 MB | 687ms | 768ms | 1.04s | 2.4s |
| 4 MB | 255ms | 399ms | 1.04s | 1.91s |
Generally, an higher window size shows a lower latency.
The default behaviour has a dynamic window size, because it gets adjusted by the BDP estimator. Looking a single run, it's interesting to see how the latency varies when the BDP triggers. For example:
$ go run . --target=client --client.requests=10 --client.concurrency=1

Default window size
Num requests: 10 Concurrency: 1
BDP estimator updating window size to 131070 bytes
BDP estimator updating window size to 199824 bytes
BDP estimator updating window size to 299952 bytes
Request #0 took 545.449853ms
BDP estimator updating window size to 408268 bytes
BDP estimator updating window size to 616568 bytes
Request #1 took 1.214302042s
Request #2 took 2.315284614s
Request #3 took 2.295576774s
Request #4 took 2.191588355s
Request #5 took 2.401036877s
Request #6 took 2.289694835s
Request #7 took 2.186450247s
Request #8 took 2.301560832s
Request #9 took 2.401596138s
Min: 545.449853ms Max: 2.401596138s Avg: 2.014254056s

$ go run . --target=client --client.requests=10 --client.concurrency=8

Default window size
Num requests: 10 Concurrency: 8
BDP estimator updating window size to 133184 bytes
BDP estimator updating window size to 226862 bytes
BDP estimator updating window size to 370496 bytes
BDP estimator updating window size to 632754 bytes
BDP estimator updating window size to 1007930 bytes
BDP estimator updating window size to 1399292 bytes
Request #6 took 1.865037358s
Request #2 took 1.867418215s
Request #1 took 1.868837177s
Request #7 took 1.869603894s
Request #0 took 1.870311658s
Request #3 took 1.870332992s
Request #5 took 1.870338413s
Request #4 took 1.871515632s
Request #9 took 423.718733ms
Request #8 took 428.444837ms
Min: 423.718733ms Max: 1.871515632s Avg: 1.58055589s
Testing fixed window size
I've built store-gateway-load-test tool with a fixed window size (tried 1MB, 4MB and 16MB). I haven't got a better latency then running it with the default (BDP estimator enabled) and Send() still accounts for more than 50% of latency during load test. This may be related to an overwhelmed store-gateway-load-test, so I reduced its concurrency to 1: got better results but Send() is still a significative part of the latency.
Preliminary conclusion
My results are inconclusive so far.
In the local test done with a dummy implementation, looks like the default behaviour (BDP estimator) performs well when there's some concurrency, while may not be that good when there's only 1 inflight request. However, testing the same changes to a real Mimir cluster (tested with store-gateway-load-test tool) I haven't got significantly better results than with BDP estimator (neither worse).
Next steps:
- Wait to rollout new
Series()latency breakdown metric to production and see how much theSend()impacts there - Serialize messages before calling
Send()and then send aPreparedMsgso we can clearly measure marshalling and sending separately (originated by a feedback received by @fpetkovski) - Experiment with a different
Series()response format where multiple series can be sent in the same message
Wait to rollout new Series() latency breakdown metric to production and see how much the Send() impacts there
We're rolling out the new metrics to production and we have preliminary results:

-
Left: % of time taken by
Send()on average, on per Mimir cluster basis, compare to the wholeSeries()request - Right: % of time saved by preloading on average, on a per Mimir cluster basis
As expected, preloading is more effective when Send() is slower. In most cases Send() is < 30% of the time taken by the whole Series() request.
Action item: ss suggested by @fpetkovski I'm now even more convinced we should measure the actual time taken by encoding the message and the Send() separately, so we have a better understand of how much encoding accounts.
Action item: ss suggested by @fpetkovski I'm now even more convinced we should measure the actual time taken by encoding the message and the Send() separately, so we have a better understand of how much encoding accounts.
Opened a PR to track the encode timing separately. From a quick load test in dev looks like SendMsg() is still bigger than encoding the message, but let's see in production in a couple of weeks.
Here's something I realized a week or so ago, but forgot to post here.
I think the reason for having Send take up some much time compared to fetching series is that they overlap and we measure the time spent from Send's perspective. An example
start                                      end
|-------------------------------------------|
|   send (10ms)   |-------------------------|
|   fetch (12ms)      |---------------------|
In this case we would record send taking 10ms and fetch taking only 2ms. Here we take the fetch duration as the time we have spent in the function minus the time spent sending.
https://github.com/grafana/mimir/blob/b34913fba0267cd8e2920dbebadba945bd397343/pkg/storegateway/bucket.go#L796-L797
The code will change with #6616, but the semantics will remain.
If we change tracking to be from the fetching point of view - send = time spent waiting for a preloaded batch to be picked up, then we will have a similar disbalance.