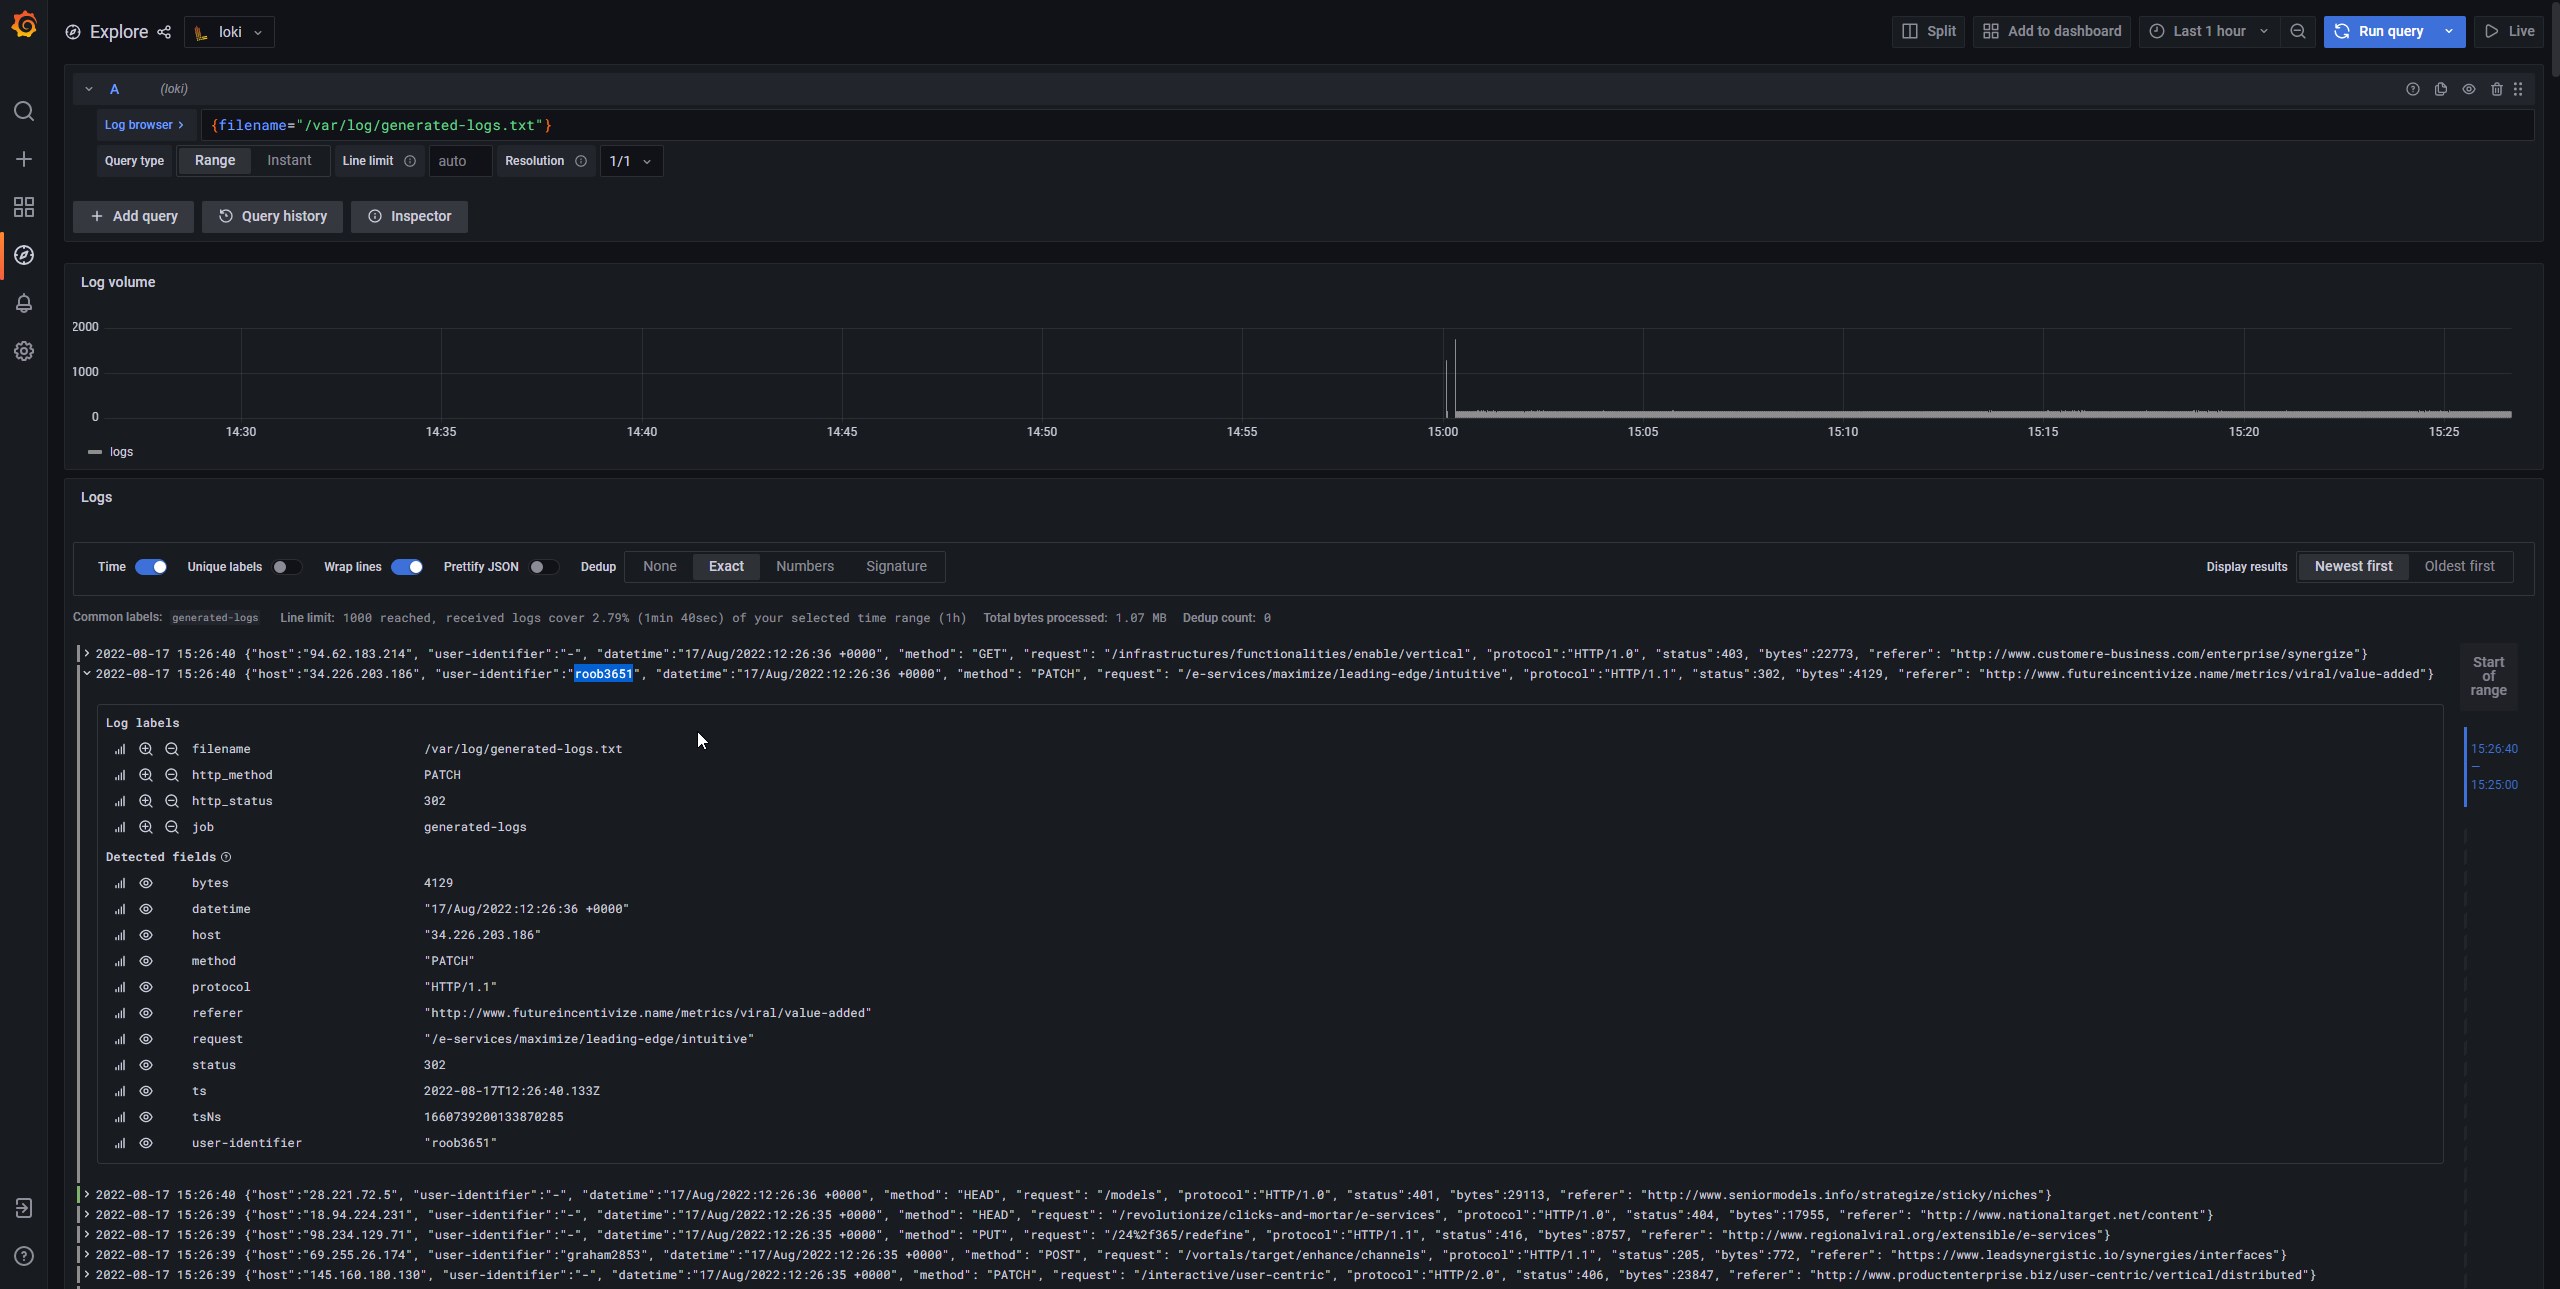
Loki frontend returns duplicates
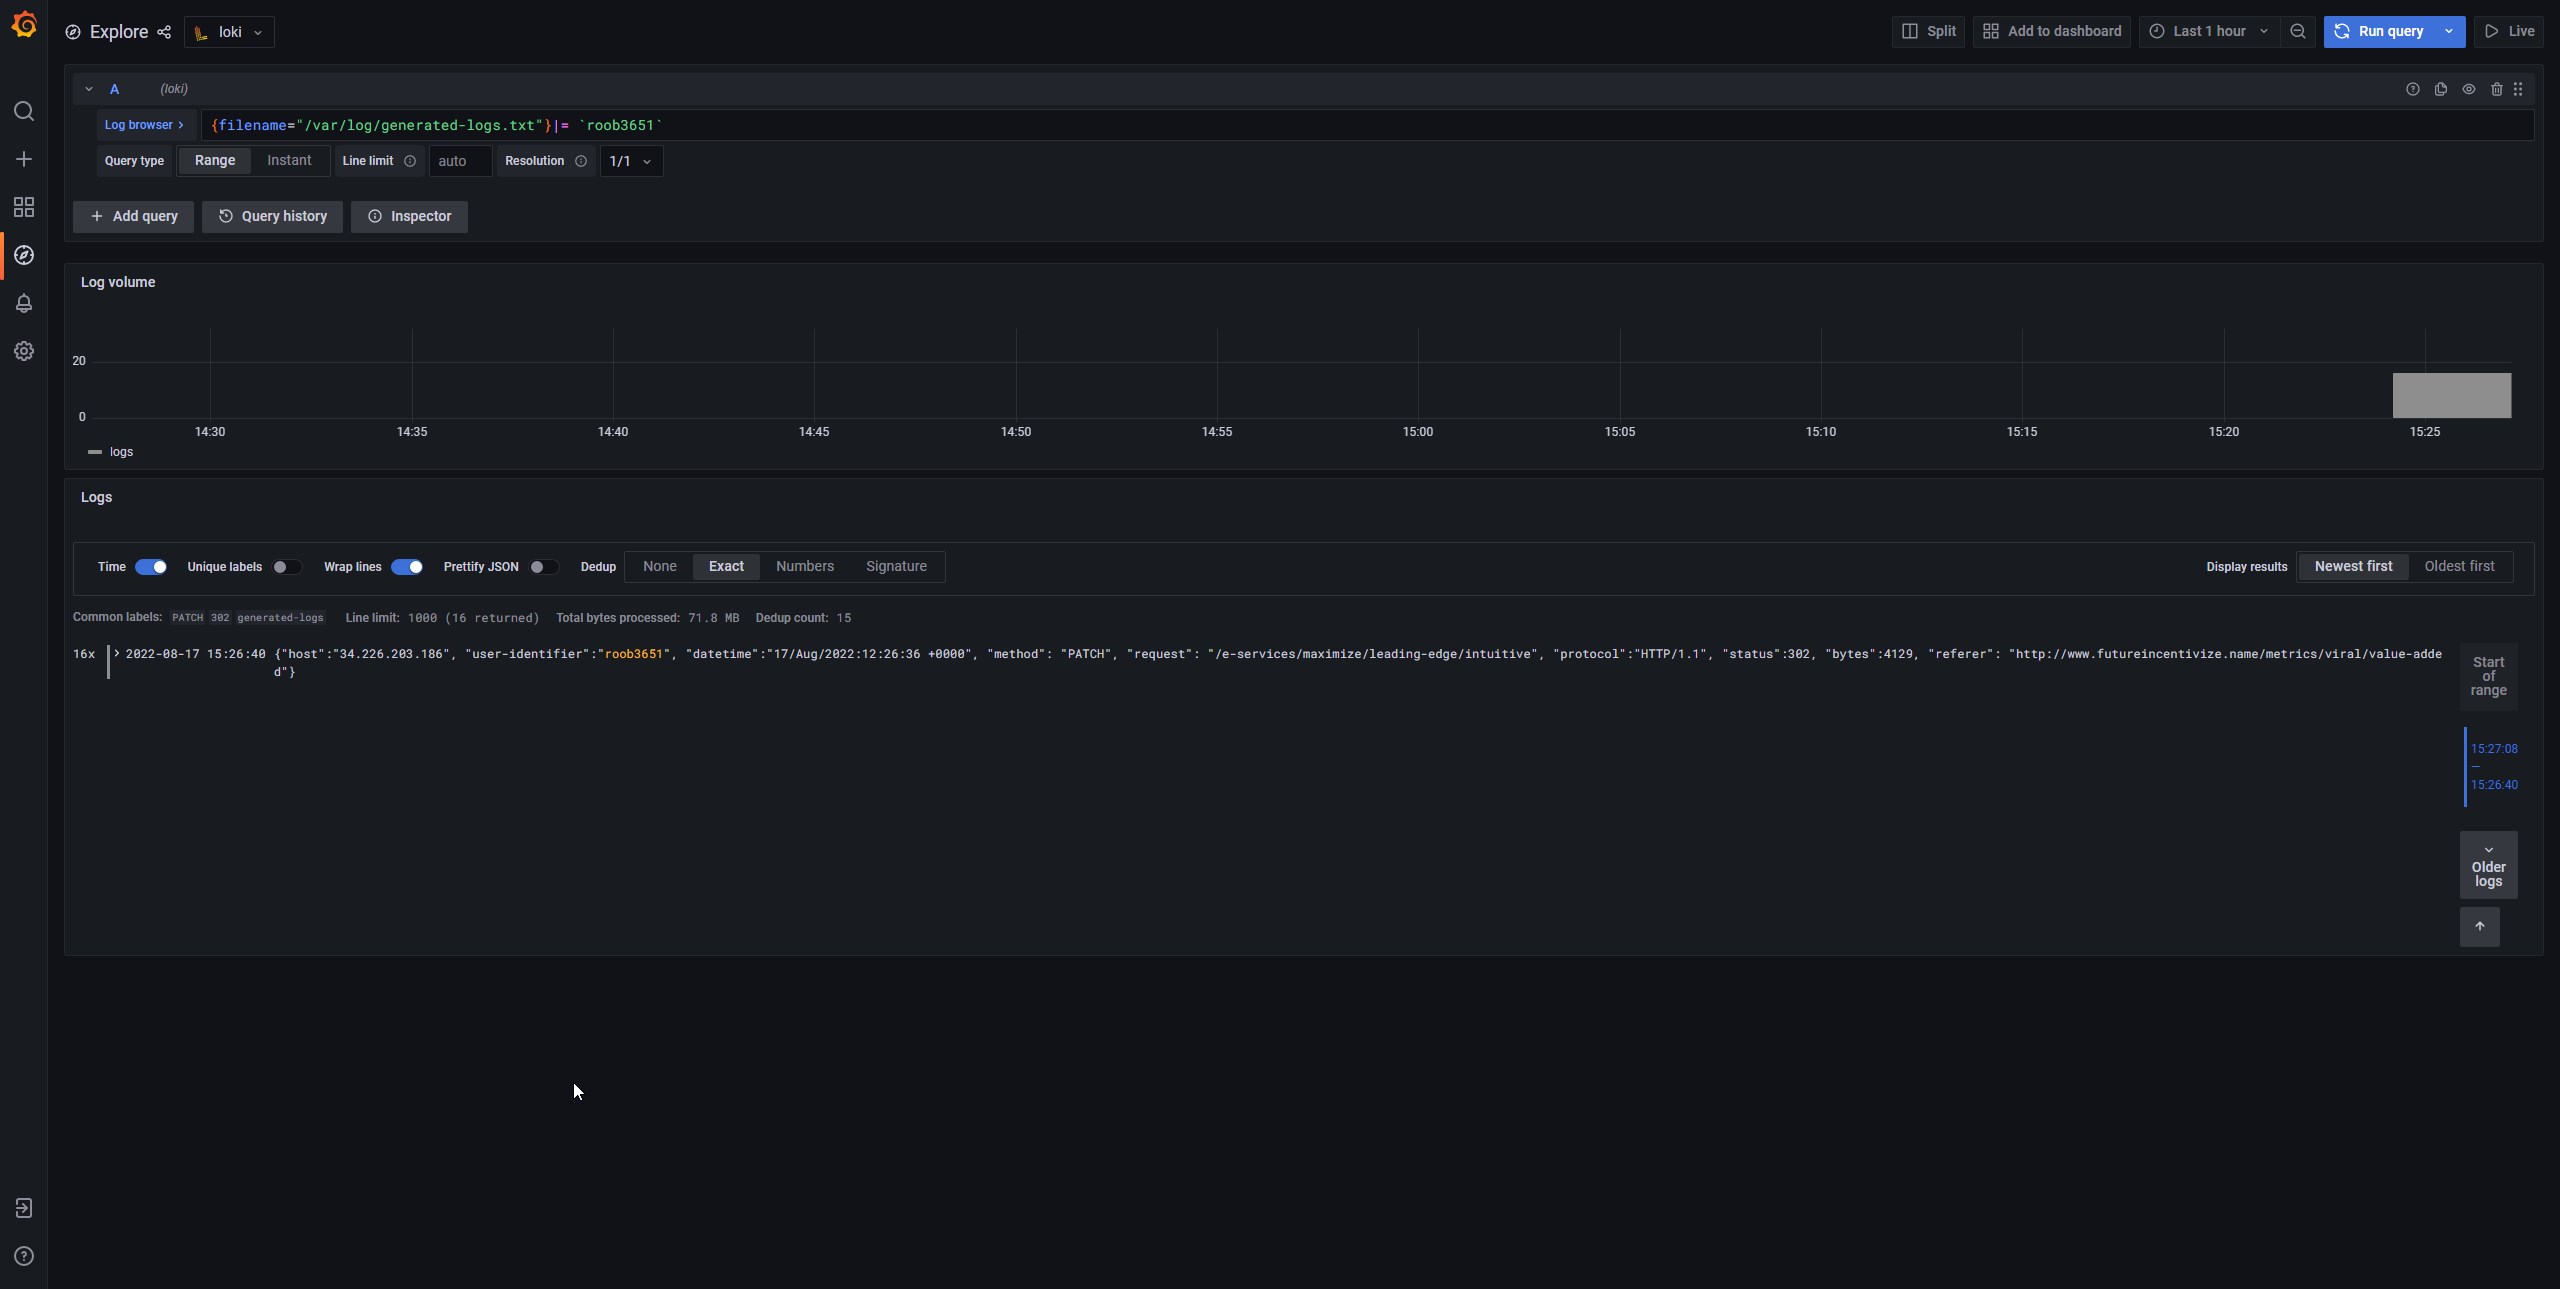
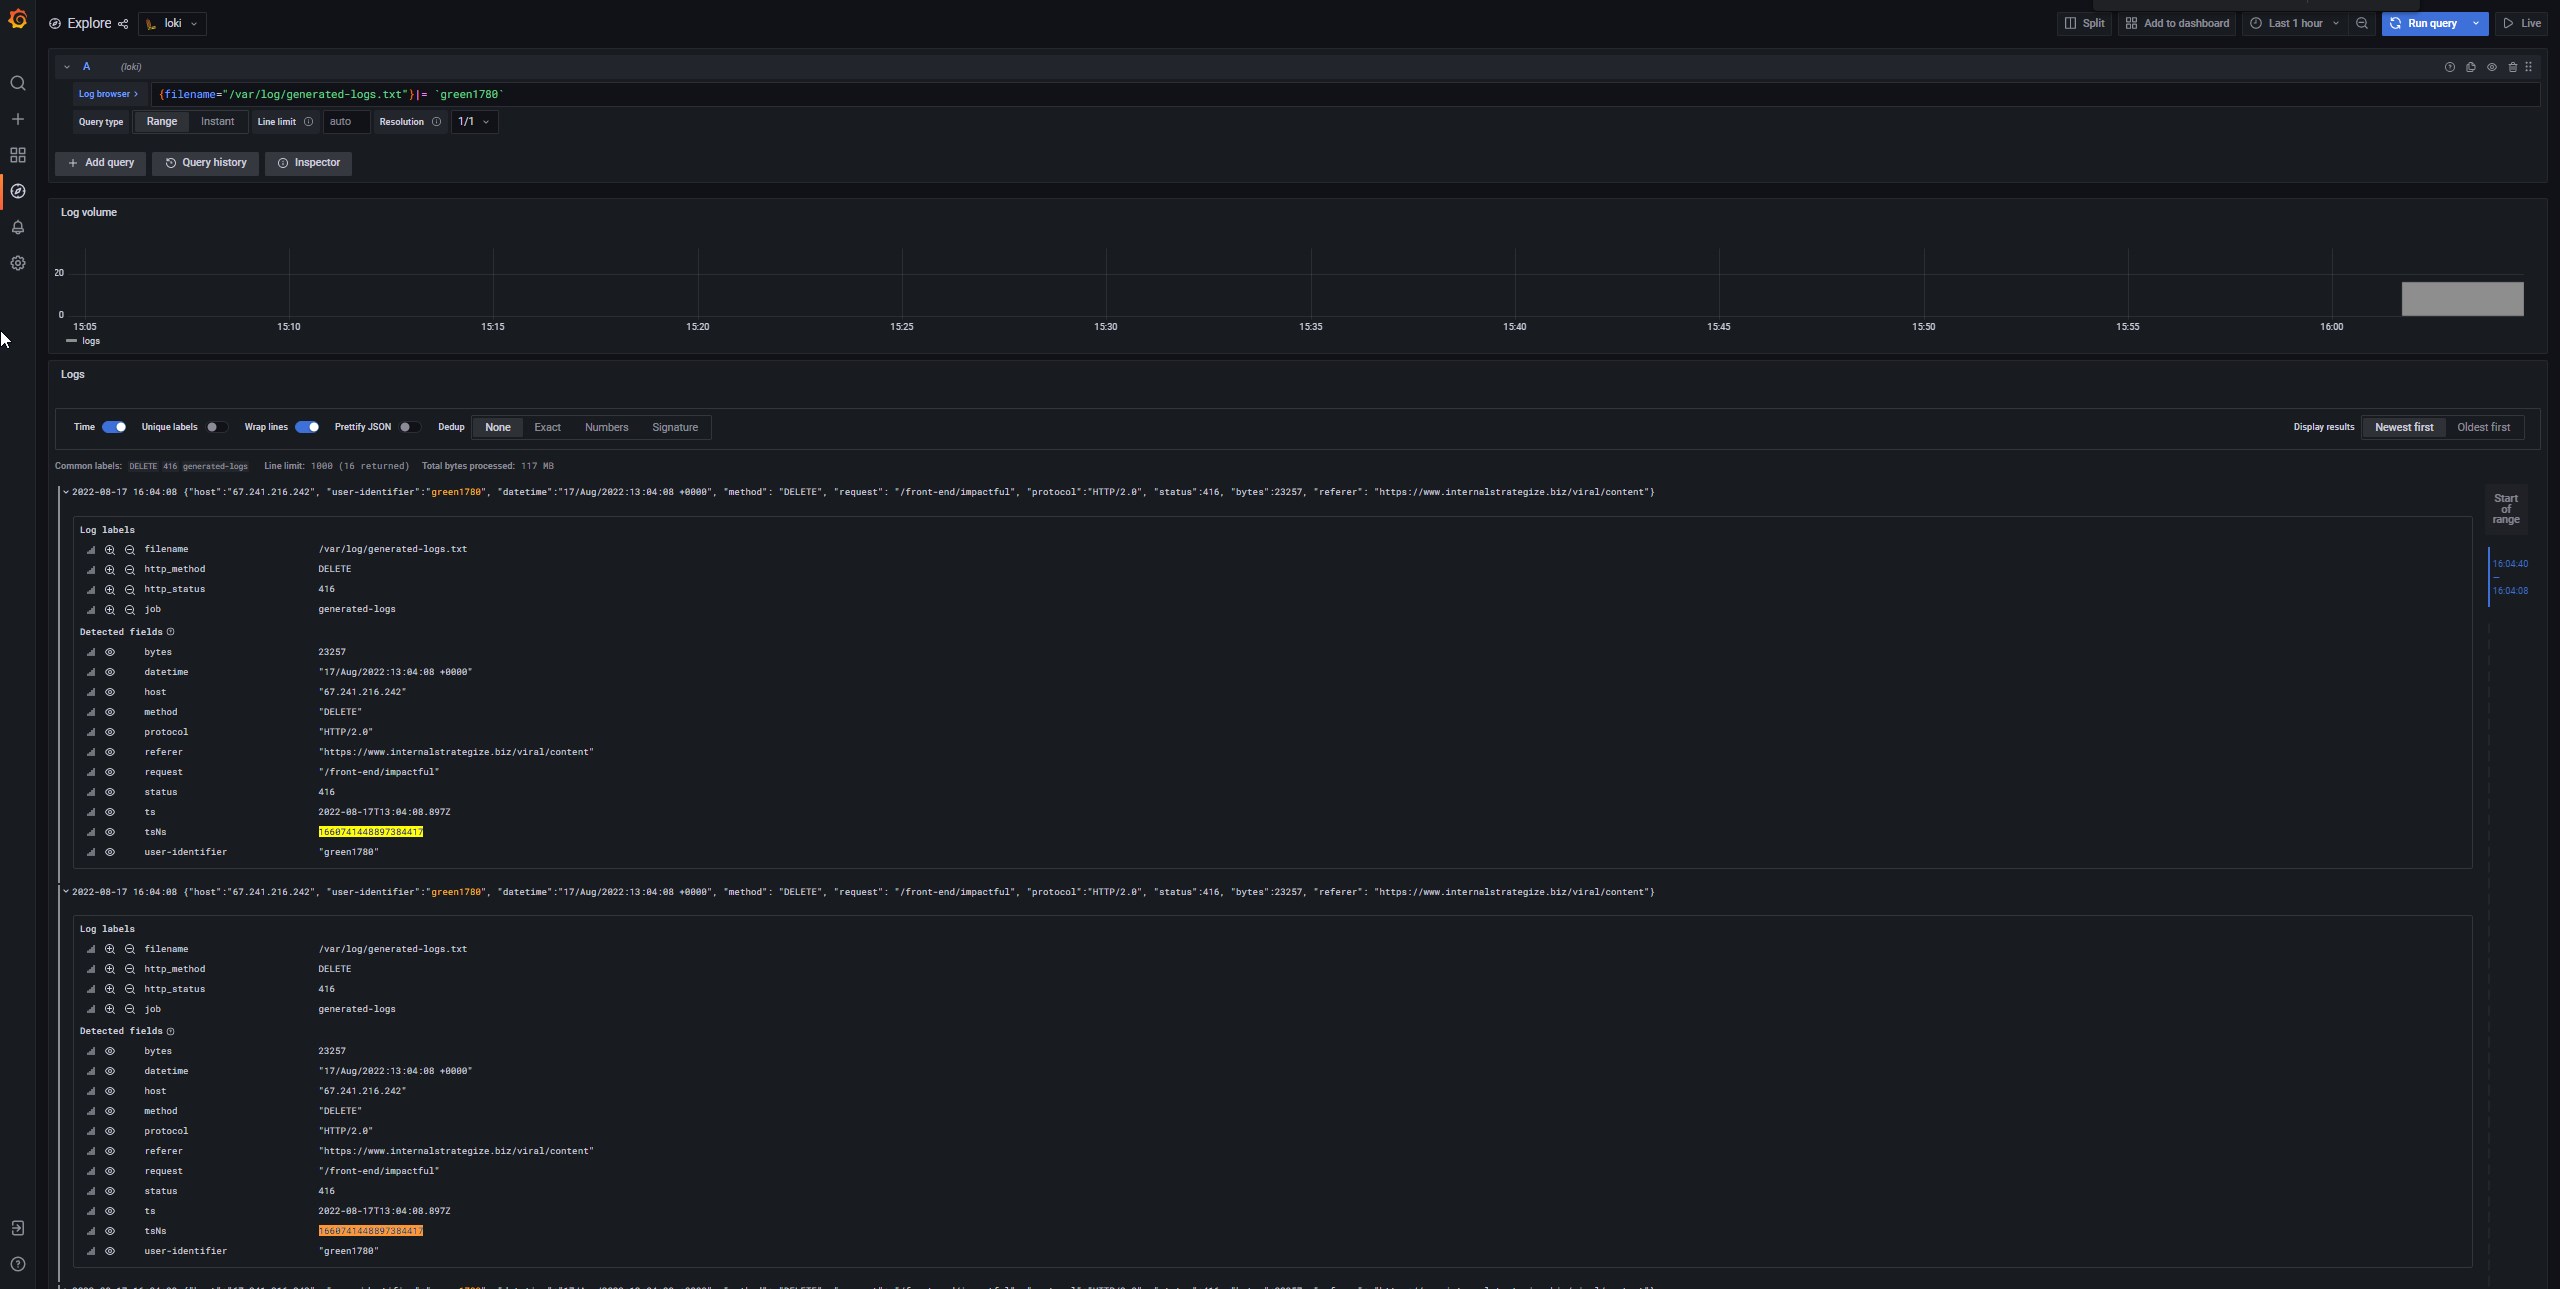
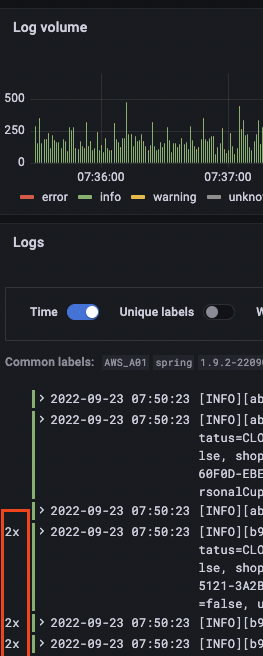
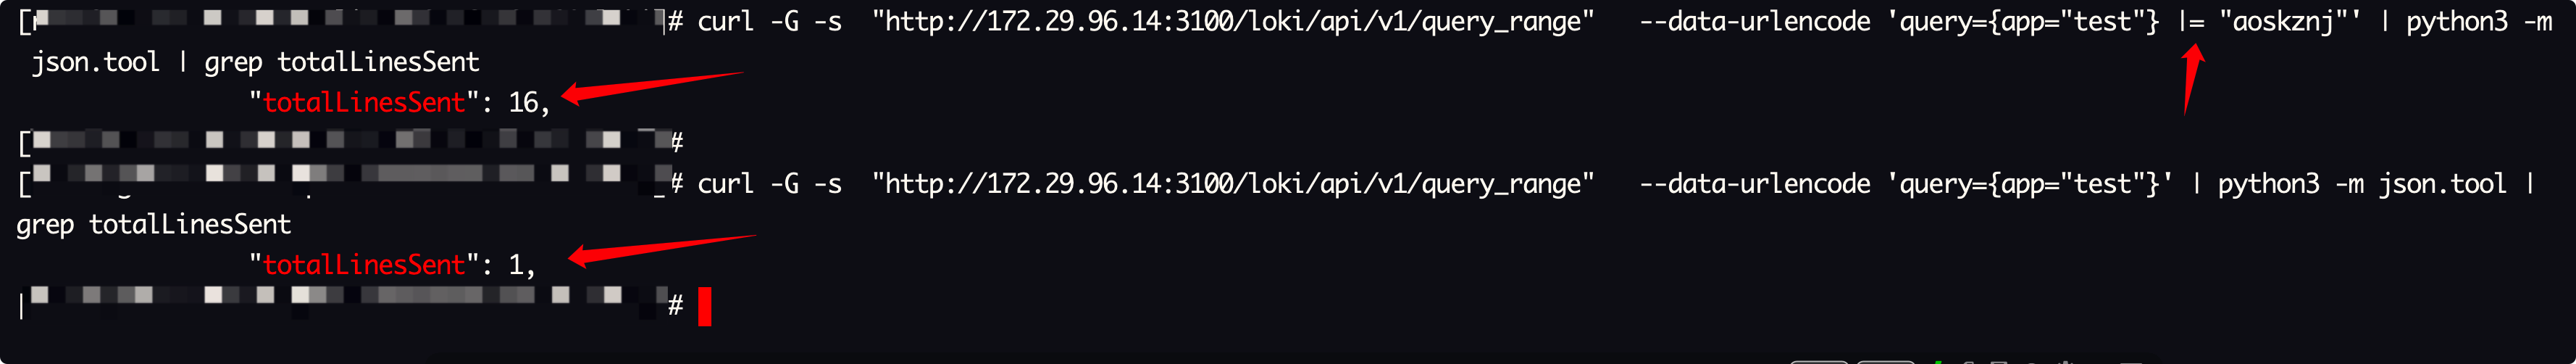
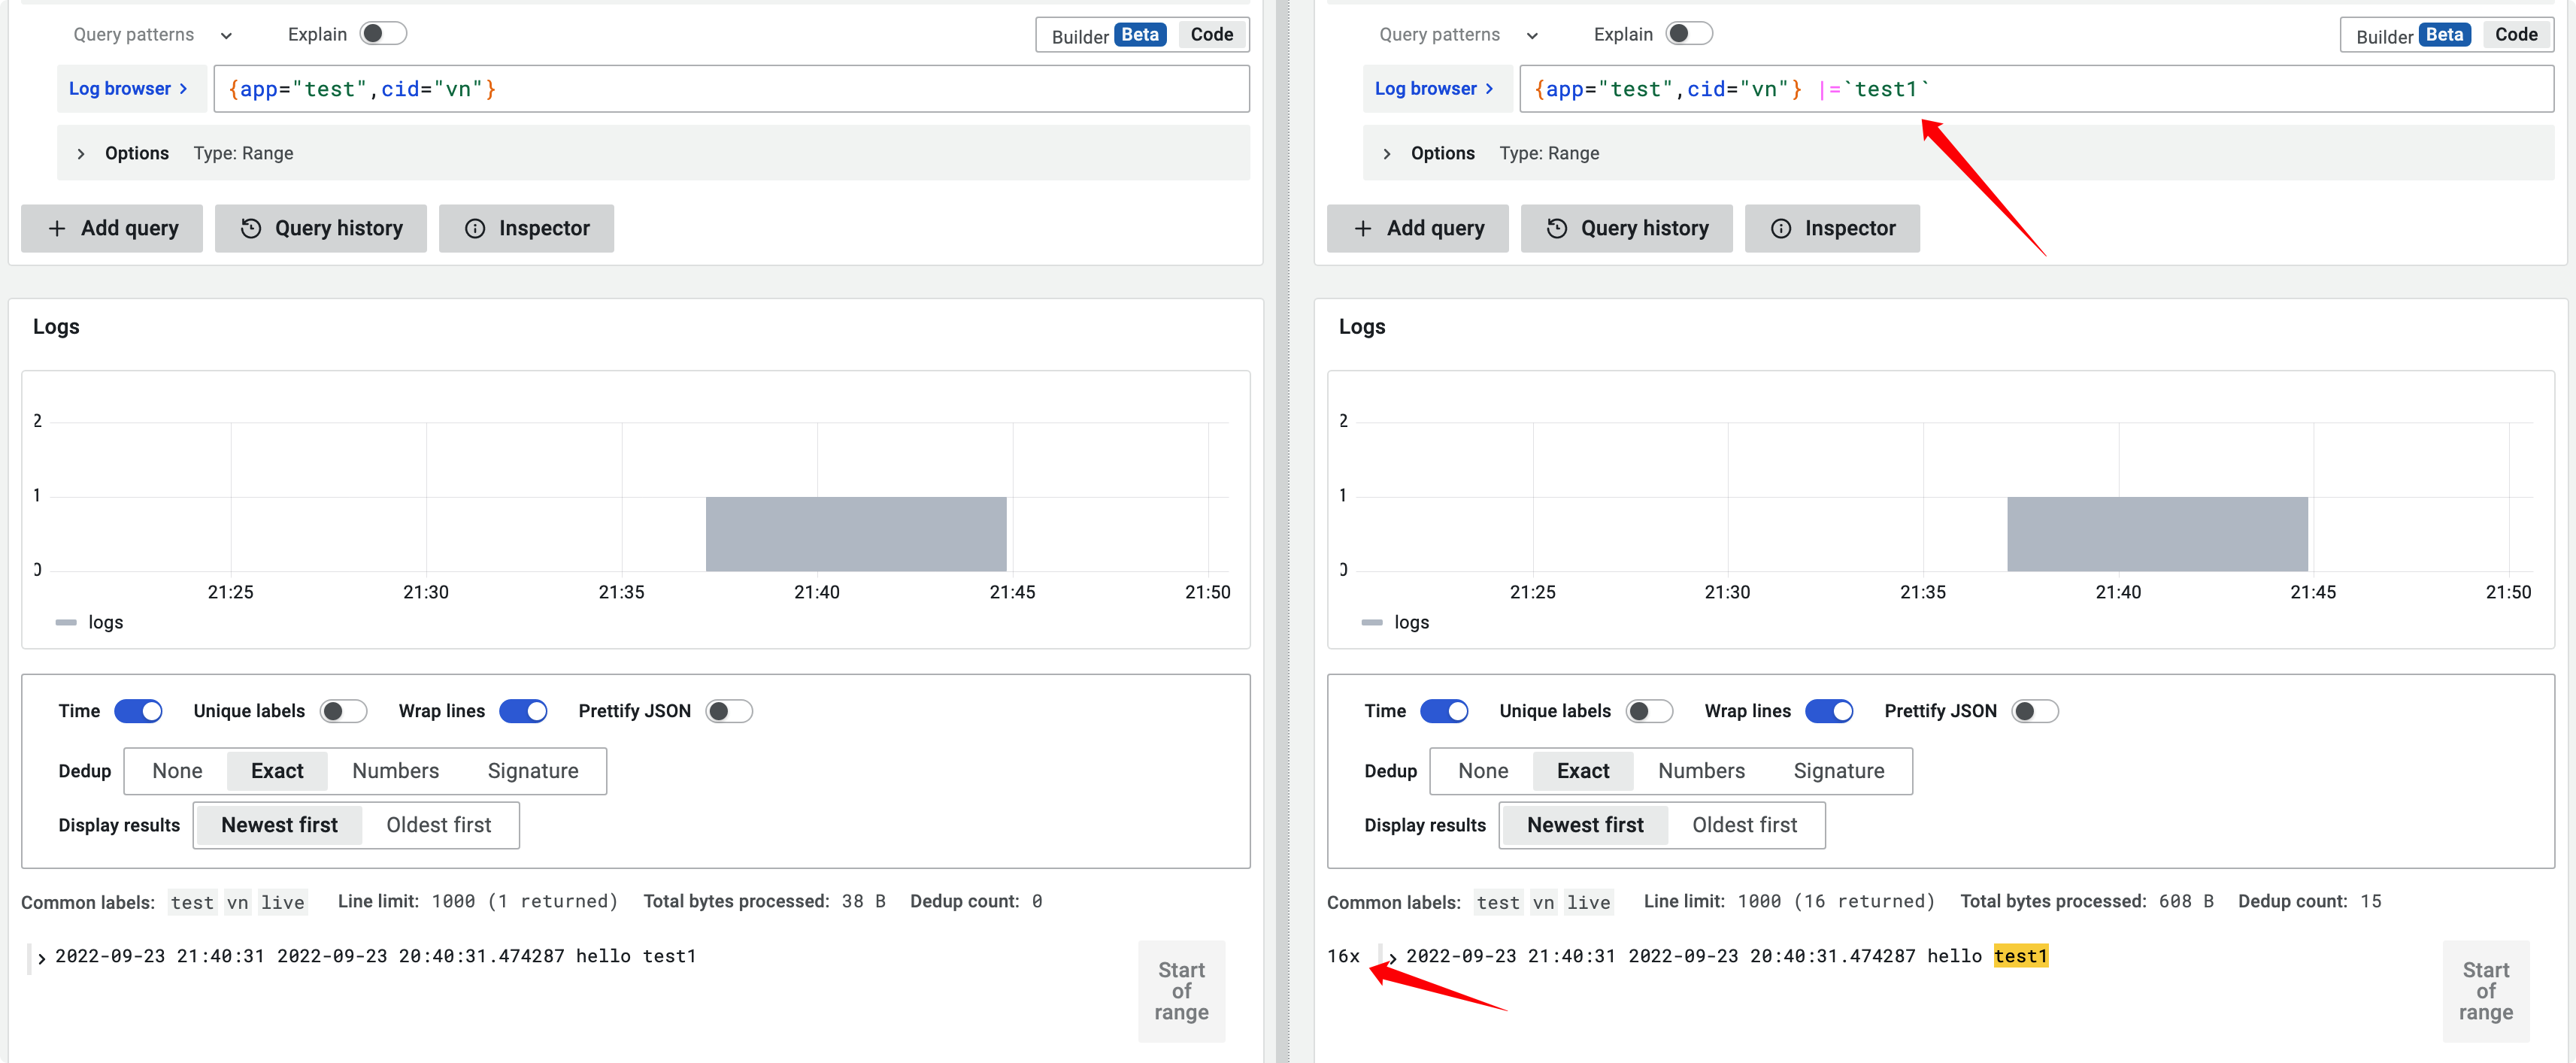
Describe the bug Loki frontend returns 16x duplicates when using filter by string
To Reproduce Steps to reproduce the behavior:
- Clone repo from current main https://github.com/grafana/loki/commit/965650740cb54d6a2cc5ee2f931ea01af44ac48e
- Go to production/docker folder
- Started Loki from docker-compose.yaml
- Open grafana
- Filter logs by string
Expected behavior Return logs without duplicates
Environment:
- Infrastructure: laptop
- Deployment tool: docker-compose
Screenshots, Promtail config, or terminal output
I'll try to replicate this. Which version are you using?
i just clone current master 965650740
I quickly built a new Loki binary using that version, sent replicated logs, and couldn't replicate this (running in monolithic mode). So it might be an edge case :thinking:
double checking, can you confirm that the complete timestamps are exactly the same? (in nanoseconds)
double checking, can you confirm that the complete timestamps are exactly the same? (in nanoseconds)
yep, absolutely the same
Easiest way to reproduce
- Clone repo from current main 25e8365d0
- Go to production/docker folder
docker compose up -dcurl -s -H 'X-Scope-OrgID:Tenant1' -H "Content-Type: application/json" -XPOST -s "http://localhost:8080/loki/api/v1/push" --data-raw '{"streams": [{ "stream": { "foo": "bar2" }, "values": [ [ '\"$(date +%s%N)\"', "fizzbuzz" ] ] }]}'curl -G -s -H 'X-Scope-OrgID:Tenant1' "http://localhost:8080/loki/api/v1/query_range" --data-urlencode 'query={foo="bar2"}' --data-urlencode 'step=300' | jqcurl -G -s -H 'X-Scope-OrgID:Tenant1' "http://localhost:8080/loki/api/v1/query_range" --data-urlencode 'query={foo="bar2"}|=fizzbuzz' --data-urlencode 'step=300' | jq
And we see data.result.values 16x times with the same timestamp
{
  "status": "success",
  "data": {
    "resultType": "streams",
    "result": [
      {
        "stream": {
          "foo": "bar2"
        },
        "values": [
          [
            "1660816430487235740",
            "fizzbuzz"
          ],
          [
            "1660816430487235740",
            "fizzbuzz"
          ],
          [
            "1660816430487235740",
            "fizzbuzz"
          ],
          [
            "1660816430487235740",
            "fizzbuzz"
          ],
          [
            "1660816430487235740",
            "fizzbuzz"
          ],
          [
            "1660816430487235740",
            "fizzbuzz"
          ],
          [
            "1660816430487235740",
            "fizzbuzz"
          ],
          [
            "1660816430487235740",
            "fizzbuzz"
          ],
          [
            "1660816430487235740",
            "fizzbuzz"
          ],
          [
            "1660816430487235740",
            "fizzbuzz"
          ],
          [
            "1660816430487235740",
            "fizzbuzz"
          ],
          [
            "1660816430487235740",
            "fizzbuzz"
          ],
          [
            "1660816430487235740",
            "fizzbuzz"
          ],
          [
            "1660816430487235740",
            "fizzbuzz"
          ],
          [
            "1660816430487235740",
            "fizzbuzz"
          ],
          [
            "1660816430487235740",
            "fizzbuzz"
          ]
        ]
      }
    ],
    "stats": {
      "summary": {
        "bytesProcessedPerSecond": 1041,
        "linesProcessedPerSecond": 130,
        "totalBytesProcessed": 256,
        "totalLinesProcessed": 32,
        "execTime": 0.245710213,
        "queueTime": 50.676309619,
        "subqueries": 5,
        "totalEntriesReturned": 16
      },
      "querier": {
        "store": {
          "totalChunksRef": 0,
          "totalChunksDownloaded": 0,
          "chunksDownloadTime": 0,
          "chunk": {
            "headChunkBytes": 0,
            "headChunkLines": 0,
            "decompressedBytes": 0,
            "decompressedLines": 0,
            "compressedBytes": 0,
            "totalDuplicates": 16
          }
        }
      },
      "ingester": {
        "totalReached": 2736,
        "totalChunksMatched": 32,
        "totalBatches": 32,
        "totalLinesSent": 32,
        "store": {
          "totalChunksRef": 0,
          "totalChunksDownloaded": 0,
          "chunksDownloadTime": 0,
          "chunk": {
            "headChunkBytes": 256,
            "headChunkLines": 32,
            "decompressedBytes": 0,
            "decompressedLines": 0,
            "compressedBytes": 0,
            "totalDuplicates": 0
          }
        }
      }
    }
  }
}
This behavior since 305936a861c2c9a957649a6cf128930c8c51ef2b by https://github.com/grafana/loki/pull/6691
Thanks, no idea why it didn't show up when I tested on https://github.com/grafana/loki/issues/6929#issuecomment-1217976985 but I could easily reproduce it with this setup that you shared. I'll be investigating it today, ty.
edit: hmm thinking now, in my setup that I couldn't reproduce it I was running Loki on monolithic mode, but the docker-compose is using it in SSD mode... I'll try to isolate things to see if the cause is the SSD mode itself.
I managed to reproduce an issue (not exactly the one you saw) regardless of running with SSD or monolithic, just as long as I was querying a frontend with a filter in the query.
Nope, sorry :( I had to drop this investigation to look for other issues. It is in my radar, though.
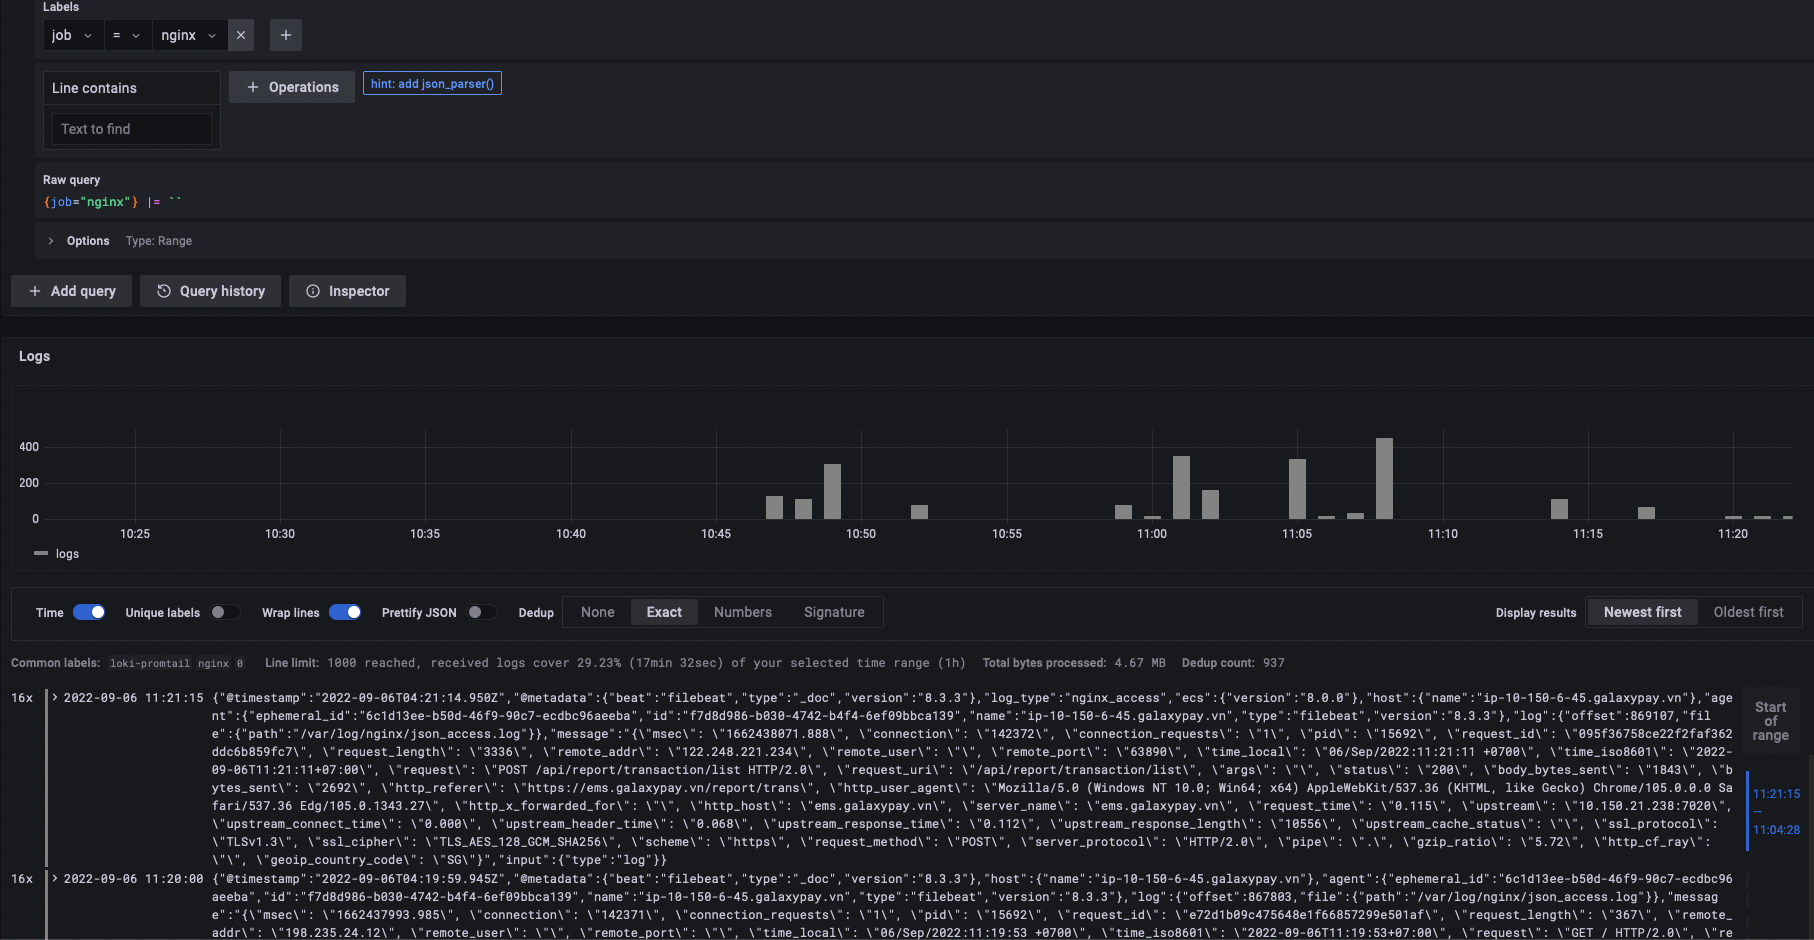
@DylanGuedes i has the same issue, use the Simple scalable deployment mode , when use filter query , frontend will return 16x lines。version : loki 2.6.1
I wrote a functional test intended to replicate the issue but unfortunately, it didn't. In case you folks are curious: https://github.com/grafana/loki/pull/7232/files
The test is:
- I push two lines, with content "LineA" and "LineB"
- I query directly from the frontend using a filter:
{job="test"} |= "lineA" - I check the number of processed lines etc. Everything seems correct :thinking:
This is my config @DylanGuedes , when i set query_range.parallelise_shardable_queries to false that frontend will rerturn correct. but i don't know why?
---
auth_enabled: false

analytics:
  reporting_enabled: false

server:
  http_listen_address: 0.0.0.0
  grpc_listen_address: 0.0.0.0
  http_listen_port: 3100
  grpc_listen_port: 9095
  log_level: info
  http_server_read_timeout: 10m
  http_server_write_timeout: 10m
  grpc_server_max_recv_msg_size: 16777216
  grpc_server_max_send_msg_size: 16777216

memberlist:
  join_members:
    - loki-read
    - loki-write
  dead_node_reclaim_time: 30s
  gossip_to_dead_nodes_time: 15s
  left_ingesters_timeout: 30s
  bind_addr: ['0.0.0.0']
  bind_port: 7946
  gossip_interval: 2s

common:
  replication_factor: 1
  storage:
    s3:
      endpoint:
      insecure: true
      bucketnames: loki
      access_key_id:
      secret_access_key:
      s3forcepathstyle: true
  ring:
    kvstore:
      store: memberlist

schema_config:
  configs:
  - from: 2022-09-15
    store: boltdb-shipper
    object_store: s3
    schema: v11
    index:
      prefix: index_
      period: 24h

ingester:
  wal:
    enabled: true
    dir: /loki/wal
    flush_on_shutdown: true
  lifecycler:
    join_after: 10s
    observe_period: 5s
    ring:
      kvstore:
        store: memberlist
      replication_factor: 1
    final_sleep: 0s
  max_chunk_age: 60m
  chunk_idle_period: 30m
  chunk_retain_period: 30m
  chunk_encoding: snappy
  chunk_target_size: 8388608
  chunk_block_size: 262144
  flush_op_timeout: 10s

distributor:
  ring:
    kvstore:
      store: memberlist

storage_config:
  boltdb_shipper:
    shared_store: s3
    active_index_directory: /loki/index
    cache_location: /loki/boltdb-cache
  index_cache_validity: 5m
  index_queries_cache_config:
    enable_fifocache: true
    redis:
      endpoint:
      password:
      expiration: 1h
      idle_timeout: 10m

chunk_store_config:
  chunk_cache_config:
    enable_fifocache: true
    redis:
      endpoint:
      password:
      expiration: 1h
      idle_timeout: 10m
  write_dedupe_cache_config:
    enable_fifocache: true
    redis:
      endpoint:
      password:
      expiration: 1h
      idle_timeout: 10m

limits_config:
  split_queries_by_interval: 30m
  enforce_metric_name: false
  reject_old_samples: true
  reject_old_samples_max_age: 168h
  max_entries_limit_per_query: 20000
  ingestion_rate_mb: 100
  ingestion_burst_size_mb: 200
  per_stream_rate_limit: 30MB
  retention_period: 360h

query_range:
  align_queries_with_step: true
  max_retries: 5
  parallelise_shardable_queries: true
  cache_results: true
  results_cache:
    cache:
      enable_fifocache: true
      fifocache:
        max_size_items: 1024
        validity: 30m
      redis:
        endpoint:
        password:
        expiration: 1h
        idle_timeout: 10m

frontend:
  log_queries_longer_than: 0s
  compress_responses: true
  max_outstanding_per_tenant: 2048

query_scheduler:
  max_outstanding_requests_per_tenant: 1024

querier:
  query_ingesters_within: 2h
  query_timeout: 5m
  tail_max_duration: 1h
  engine:
    timeout: 5m
    max_look_back_period: 30s
wow that's actually a great find, thank you. I'll now try to replicate it by changing that config.
@hejiazhen1203 I tested again (on this PR) and unfortunately I couldn't replicate the issue there even with parallelise_shardable_queries=true.
@DylanGuedes is deploy mode is Simple scalable deployment mode ?
my result
At first I couldn't replicate any issues even with SSD, but by using query-frontend+SSD I could replicate a bug/behavior that is likely linked to the issues you're experiencing.
I pushed to that PR a commit replicating the issue you're having.
I won't be able to work on a fix soon because I have a lot of other things to work on that have higher priority, but I'll let the PR that replicates the issue shared with you all so in case someone has free time you can try searching for the culprit by using git bisect+rerunning the test that exposes the bug.
@DylanGuedes and I were chatting on the side around this, the problem is this docker compose is running two query-frontends.
The read target of Loki includes a query-frontend, therefore you should not run an additional frontend separately.
Effectively queries are being split and sharded twice which is causing all the problems.
Removing the query-frontend from the docker-compose and routing all read traffic to the read container should fix the issue.
I'm experiencing the same issue reported by @germetist, exactly 16x duplicated lines when adding a string filter. It really gave me a headache. I'm also deploying the stack from /production/docker. As a quickfix I've set query_range.parallelise_shardable_queries to false.
Reading @slim-bean latest reply seems the problem is in the services architecture. Can I expect a fix anytime soon? I can probably work on this but I currently lack deep knowledge of Loki architecture. If I have time I'll submit a PR
I'm experiencing the same issue reported by @germetist, exactly 16x duplicated lines when adding a string filter. It really gave me a headache. I'm also deploying the stack from
/production/docker. As a quickfix I've setquery_range.parallelise_shardable_queriestofalse.Reading @slim-bean latest reply seems the problem is in the services architecture. Can I expect a fix anytime soon? I can probably work on this but I currently lack deep knowledge of Loki architecture. If I have time I'll submit a PR
The problem is the docker-compose setup: the read component of SSD mode already have its own query-frontend. By pointing another query-frontend to a read component we're prone to these duplications. That said, the problem isn't Loki itself, but the docker-compose that we have available. The solution is removing the query-frontend of that docker-compose manifest.
I've just created a PR https://github.com/grafana/loki/pull/8019 that fixes this issue, tested on the logging infrastructure I'm currently maintaining.
Feel free to check it out and merge it if it's appropriate.
Closing the issue as a recent change fixed the SSD configuration example to not use query-frontend.