carbon-relay-ng
 carbon-relay-ng copied to clipboard
metrics dropped with reason_is_slow_spool, why ?
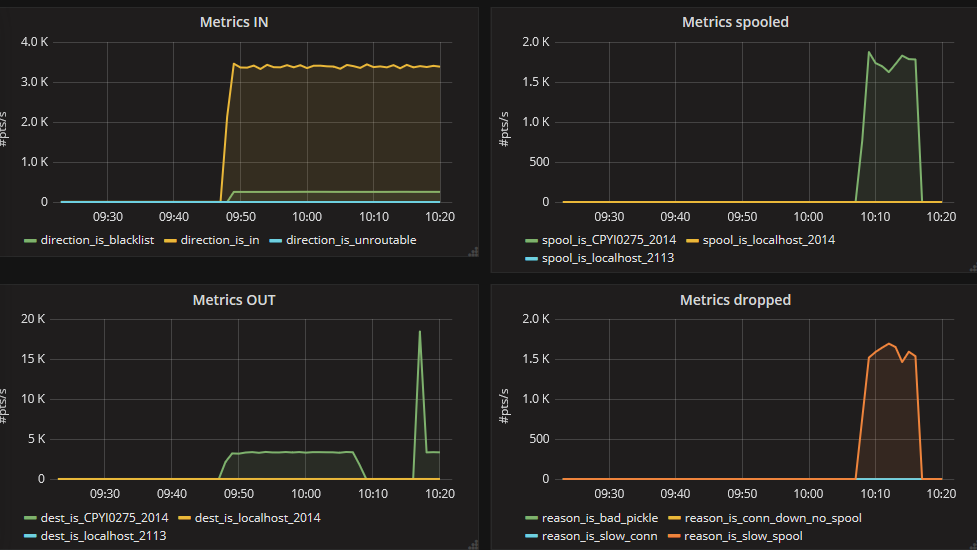
My relay-ng receives 500 metrics/s. When it spools, about 30% are dropped with reason_is_slow_spool. The disk is not loaded at all. I tried to move the spool directory on a tmpfs in ram, it changes nothing. I notice the metric operation_is_write.stat_is_max stays between 20 et 100ms when it drops. Any ideas ? Another tests show that 100% of metric used in aggregations rules are also dropped with reason_is_slow_spool. Are there some known issues with spool and aggregation rules ?
After doing a tour of go and then digging the code, I found out the issue :)
I increased the InRT buffer channel In spool.go :
         s := Spool{
		key:             key,
		InRT:            make(chan []byte, 10),
by
         s := Spool{
		key:             key,
		InRT:            make(chan []byte, 4096),
Is there any reason to have a buffer so small ?
the assumption was that InRT could be a small buffer, because we have a goroutine that is constantly reading from it, incrementing a few stat counters atomically, and logging a few things, and then putting the packets into a larger bufferthat has a default size of 10k. if you have to increase InRT then that seems like evidence that the logging calls (or maybe the stat calls) are the bottleneck. but it shouldn't be this slow that it can only handle 70% of 500/s which is 350/s which means each loop iteration would take 3ms. that's way too much.
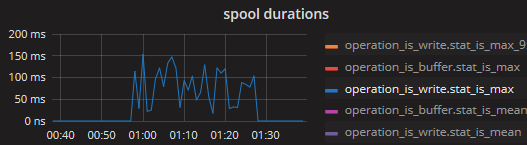
the metric operation_is_write.stat_is_max stays between 20 et 100ms when it drops
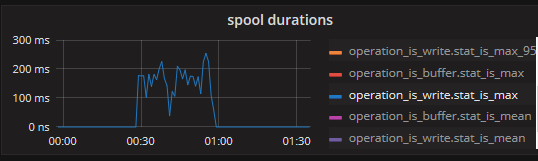
this times a request of putting the data into the actual disk backed queue, which may periodically sync and cause a block, it is expected for the max measurement to be this high. though i'm very interested to get your avg measurement of this operation.
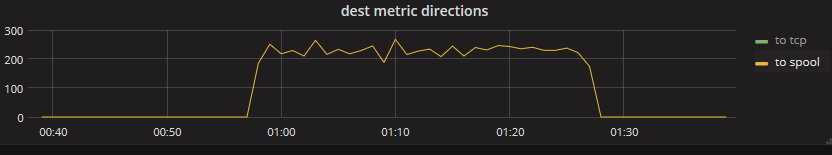
Here is the stats when spooling.
With "InRT: make(chan []byte, 4096),"
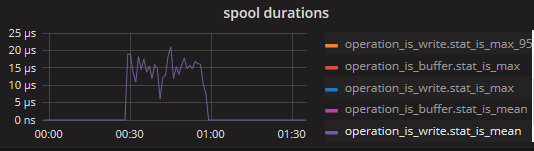
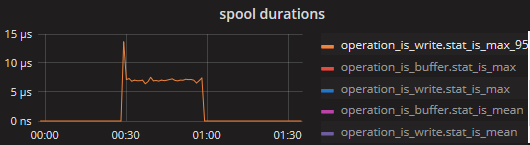
With "InRT: make(chan []byte, 10)"
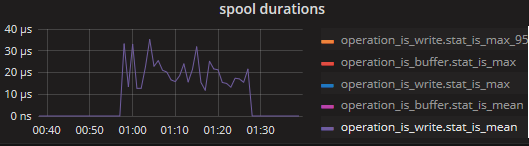
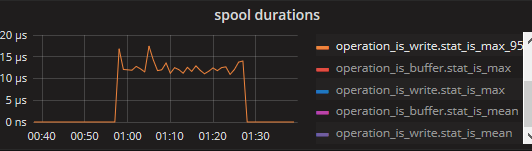
so this confirms that the writing to the disk buffer, while needing at max +- 200ms, has a much lower mean (and even p95) latency of +- 20-30 micros. since the queueBuffer can hold 10k messages, a block of 200ms (1/5 of a second) would allow a rate of about 50k/s before it starts blocking. EDIT: actually the disk buffer flushes once every second or every 10k messages, so the latter case would trigger a bit sooner, within 1 second it should be able to do 4 or 5 cycles of "10k messages sent, 200ms flush" so a rate of 40~50k/s
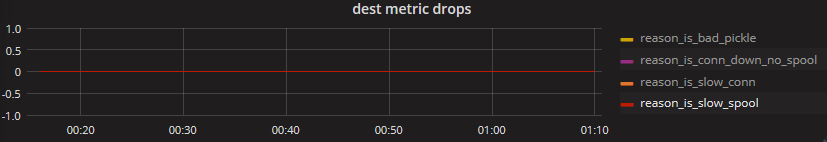
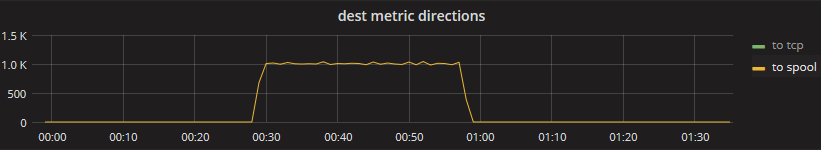
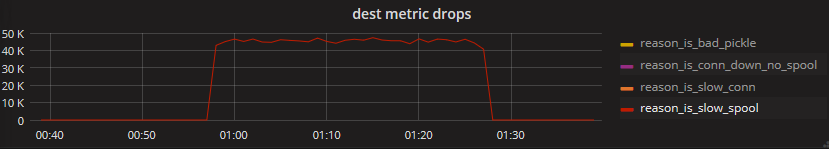
I notice in your 2nd set of charts you have about 45k/s dest drops because of "slow spool". I wonder why that number is so high. you said your relay receives only 500 metrics/s but it tries to send out >=45k/s metrics? do you have a configuration that sends the same metric many times into the same destination or something? also this number is suspiciously similar to the calculation i did above.
also can you find the gauge named spool_is_<key>.unit_is_Metric.status_is_buffered, i wonder how that one looks like (in both scenarios)
I notice in your 2nd set of charts you have about 45k/s dest drops because of "slow spool". I wonder why that number is so high.
On this graph, number is not normalized to second. This graph comes from your dashboard on grafana.com. It uses derivative(), not perSeconds(). So you must divide the scale by 60 because the counter is read every 1mn.
also can you find the gauge named spool_is_
.unit_is_Metric.status_is_buffered, i wonder how that one looks like (in both scenarios)
This metric stays always at 0 in both scenarios.
Hello, here is some news.
I upgraded from 0.8.8.13 to 0.9.4.1 (without my fix) to be able to send metrics to grafananet.
I hoped this issue would be fixed with the new spool parameters appeared in 0.9.1.
Unfortunately, the behavior is the same, when spooling, half of my metrics are rejected with the reason "slow spool". I wonder why I'm alone to encounter this issue.