ARCore has very huge and importants memory leaks
SPECIFIC ISSUE ENCOUNTERED
ARCore session has very huge memory leaks both on the Native and on the Java side. Looks like without any justifications. One of the most important is in the Session#update which needs to be called every frame.
    @NonNull
    public Frame update() throws CameraNotAvailableException {
        Frame var1 = new Frame(this);
        this.nativeUpdate(this.nativeWrapperHandle, var1.nativeHandle);
        return var1;
    }
Is it really necessery to allocate a new object every frame? This has a very huge impact on app performances...
VERSIONS USED
- Android Studio: 2021.2.1
- ARCore SDK for Android: 1.32.0
- Device manufacturer, model, and O/S: OnePlus, 6T, Android 11
- Google Play Services for AR (ARCore):
Packages:
    versionName=1.32.221520083
Hidden system packages:
    versionName=0
Active APEX packages:
Inactive APEX packages:
Factory APEX packages:
- Output of
adb shell getprop ro.build.fingerprint:
OnePlus/OnePlus6T/OnePlus6T:11/RKQ1.201217.002/2111252327:user/release-keys
Could you elaborate on the issue? Yes, there is an allocation per frame, but I don't see a leak in this particular fragment; if you do not hold onto a reference it should not exist for a long amount of time.
It is because GC is constantly getting called slowing down the whole application (If you consider that ARCore can be used also on mid-range devices this is an even bigger issue). I can't imagine that isn't possible to avoid those kinds of allocations. That one I point out is the most important I've found, but while profiling my game I've noticed a lot of those things very GC unfriendly... I'm sorry to say that the same code with ARKit works much better, which is imho pretty weird for Google.
I'd be interested to look at your breakdown of the GC pressure caused by Session#update compared to the rest of the work happening. I'll bring it up with the team, but for now I don't think it's likely to make Session#update zero alloc due to other work happening in Frame.
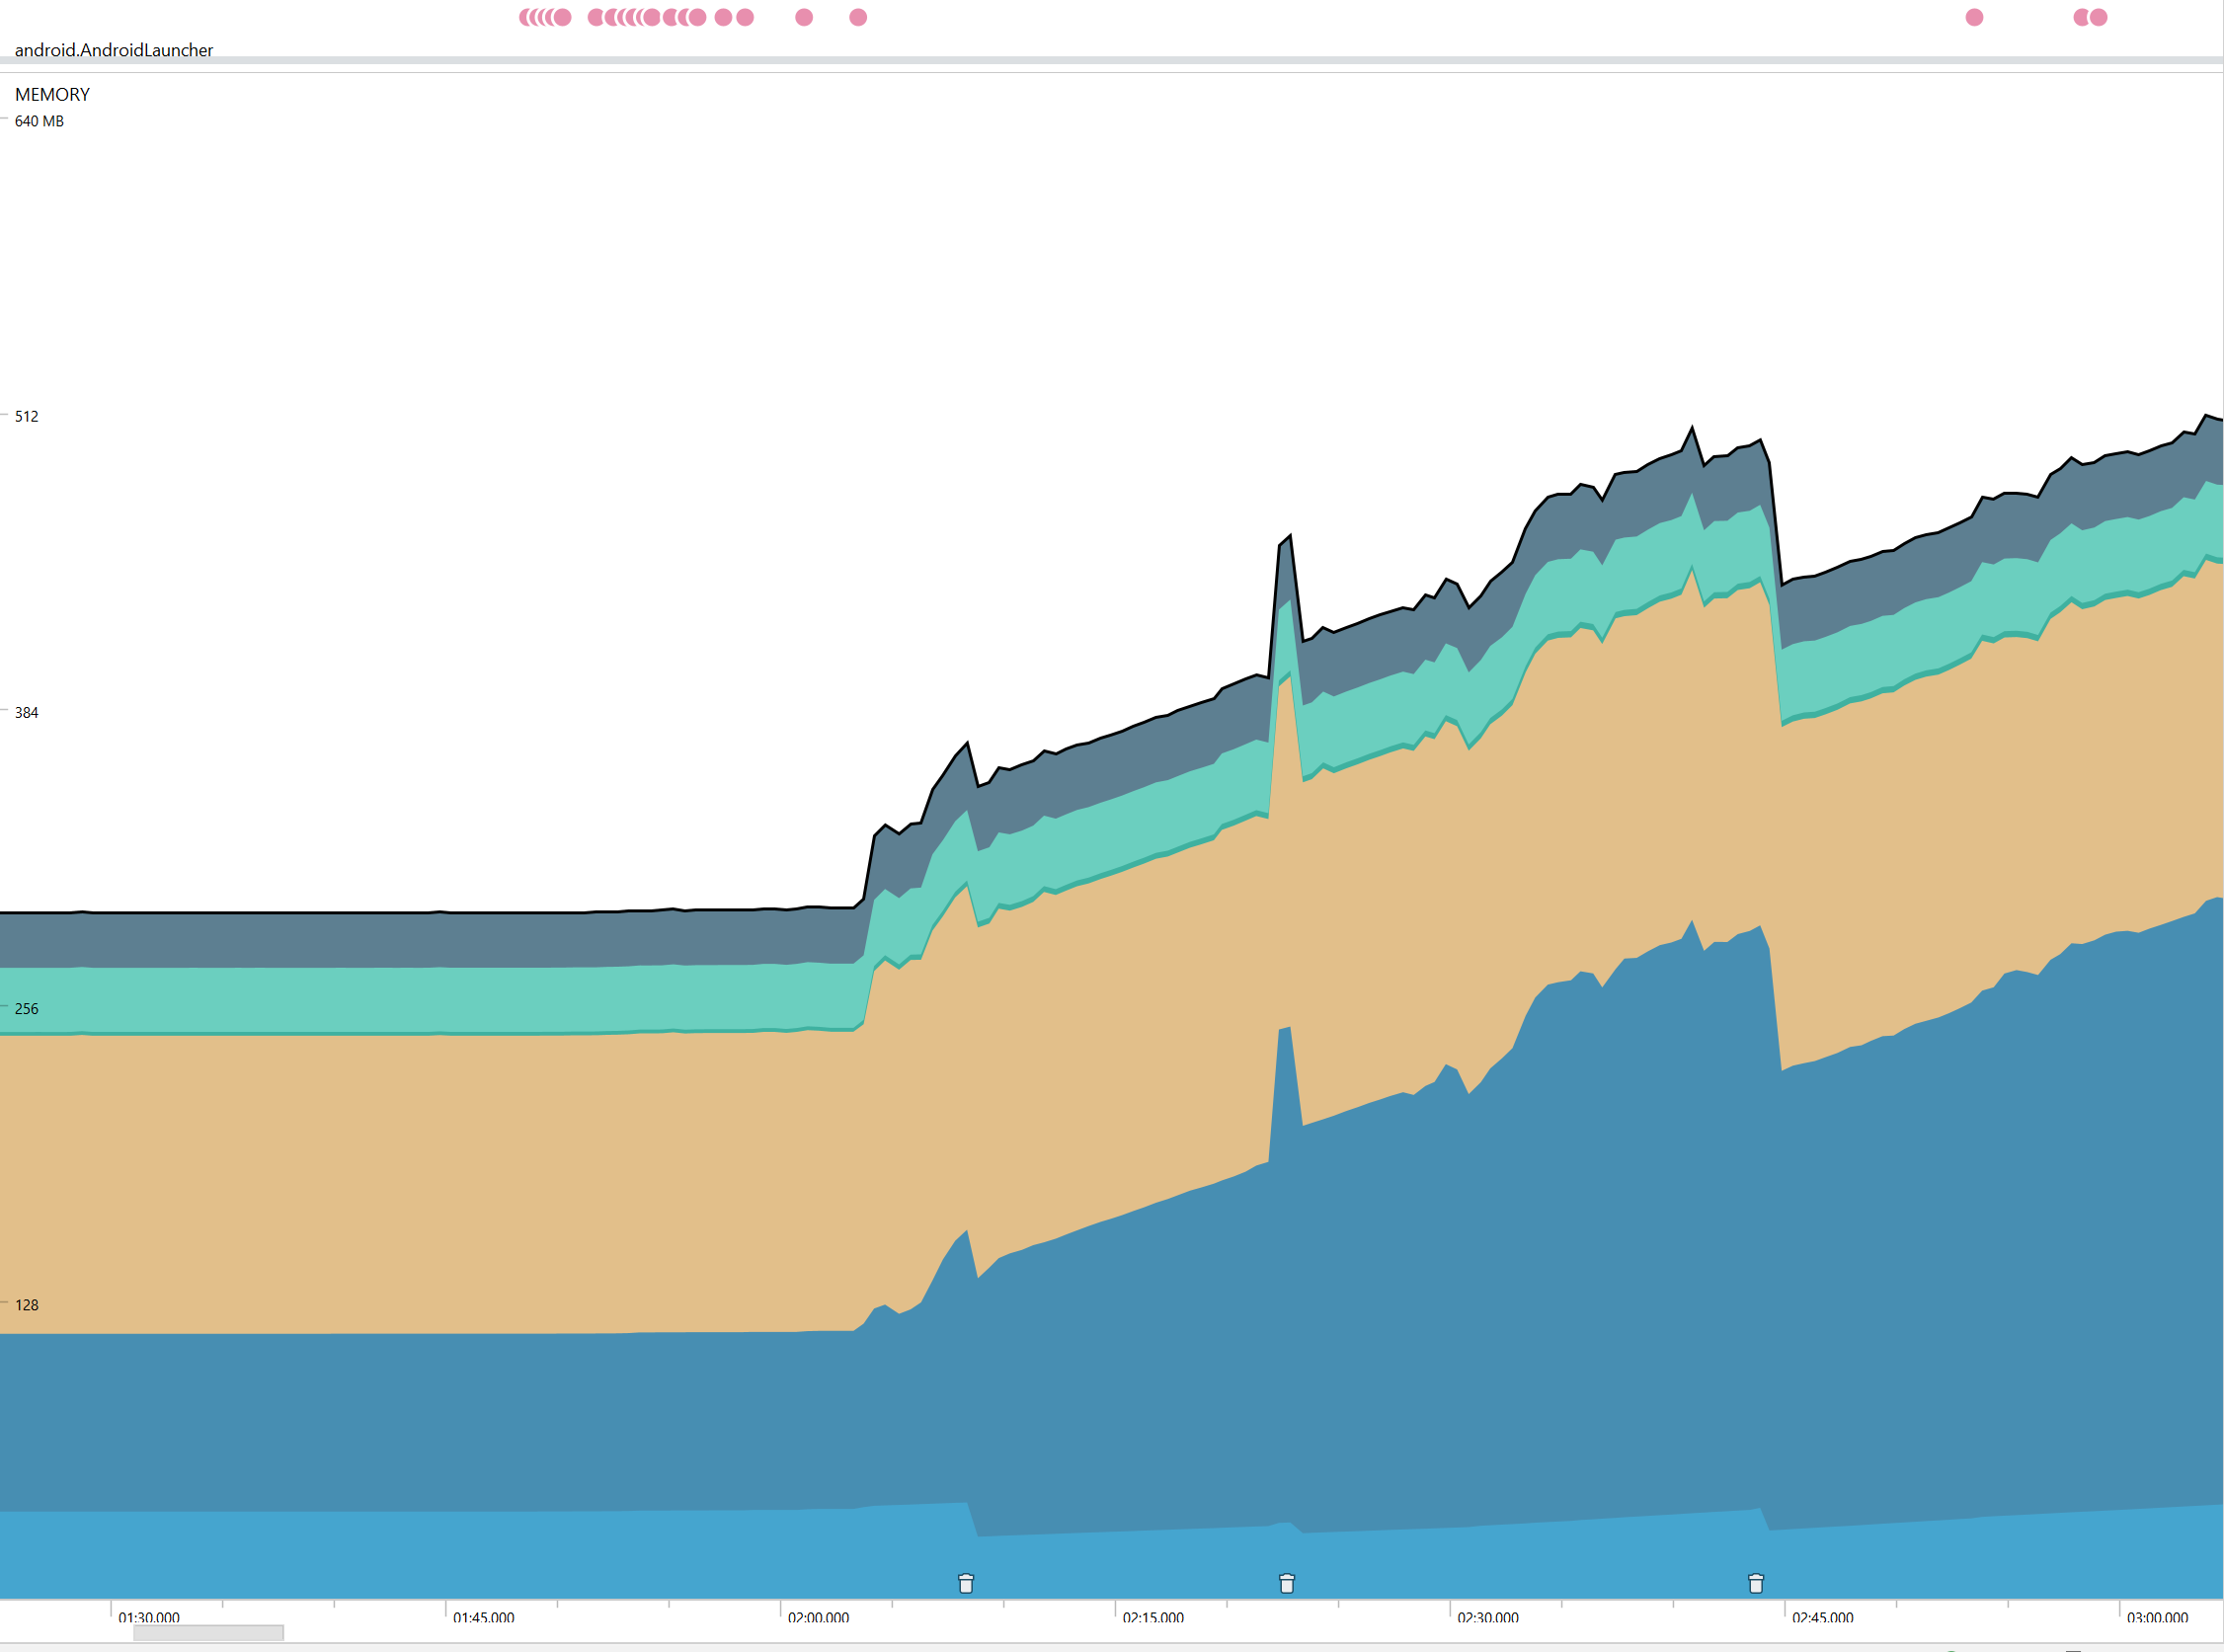
I've focused a lot to make my engine with zero allocation during rendering, as you can see from the graph memory is flat until ARCore session is started, and memory keeps increasing during the time and, after a while, the device slows pretty much.
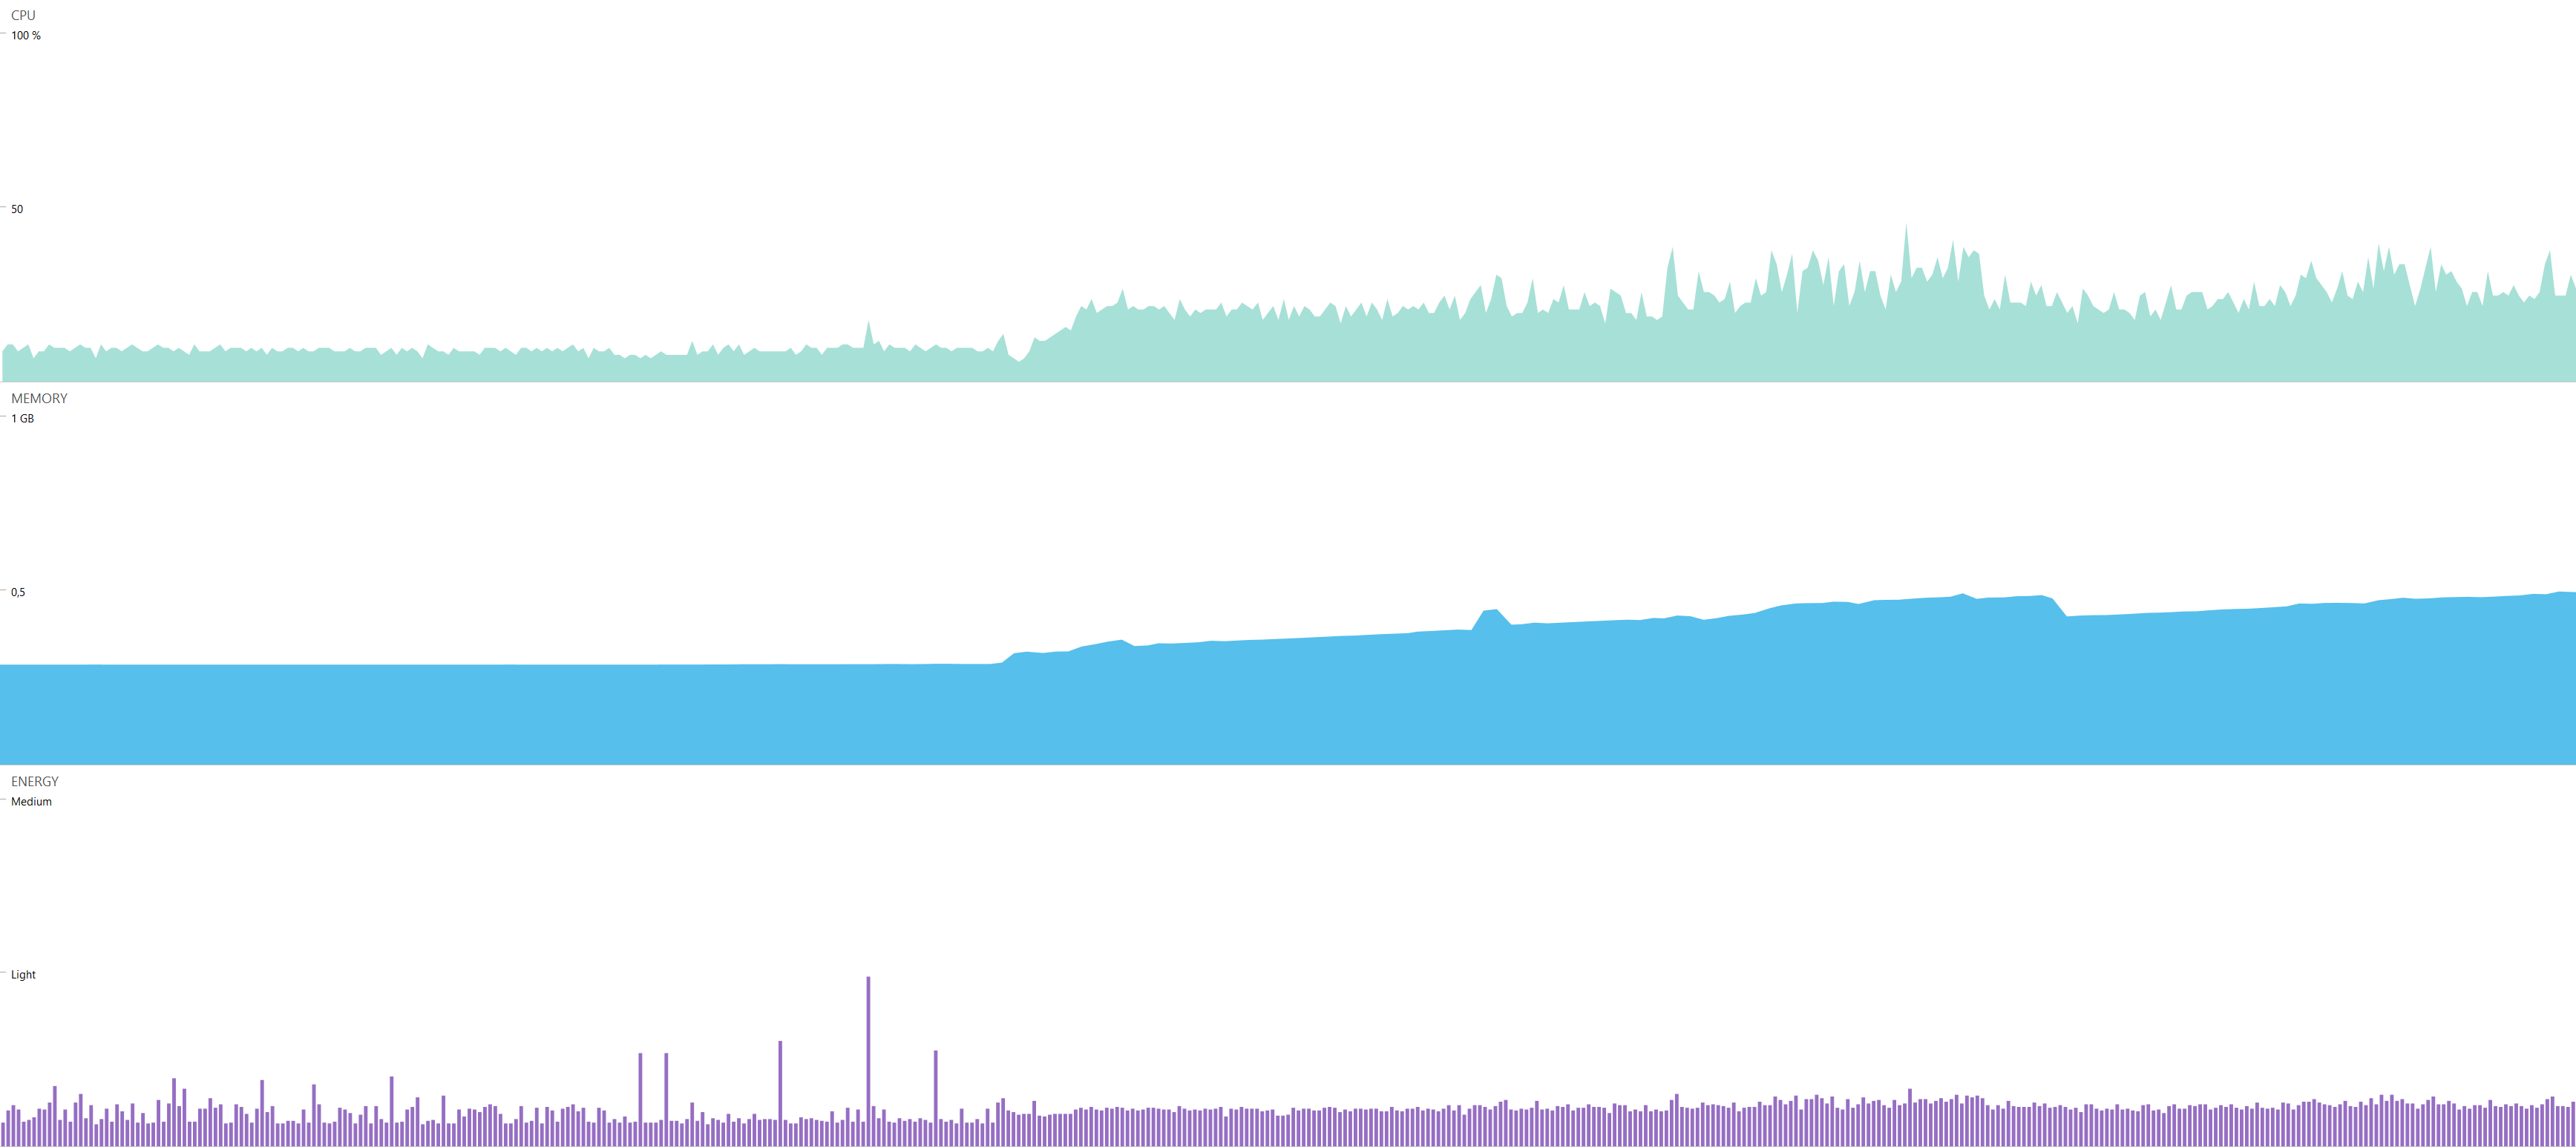
GC called every 15sec
We also had problem with memory allocation. Especially when ArCore fragment was shown multiple times in one user session. Allocated memory grown constantly. It helped to call destroyAllResources. when view is destroyed.
override fun onDestroyView() {
      ResourceManager.getInstance().destroyAllResources()
      super.onDestroyView()
  }