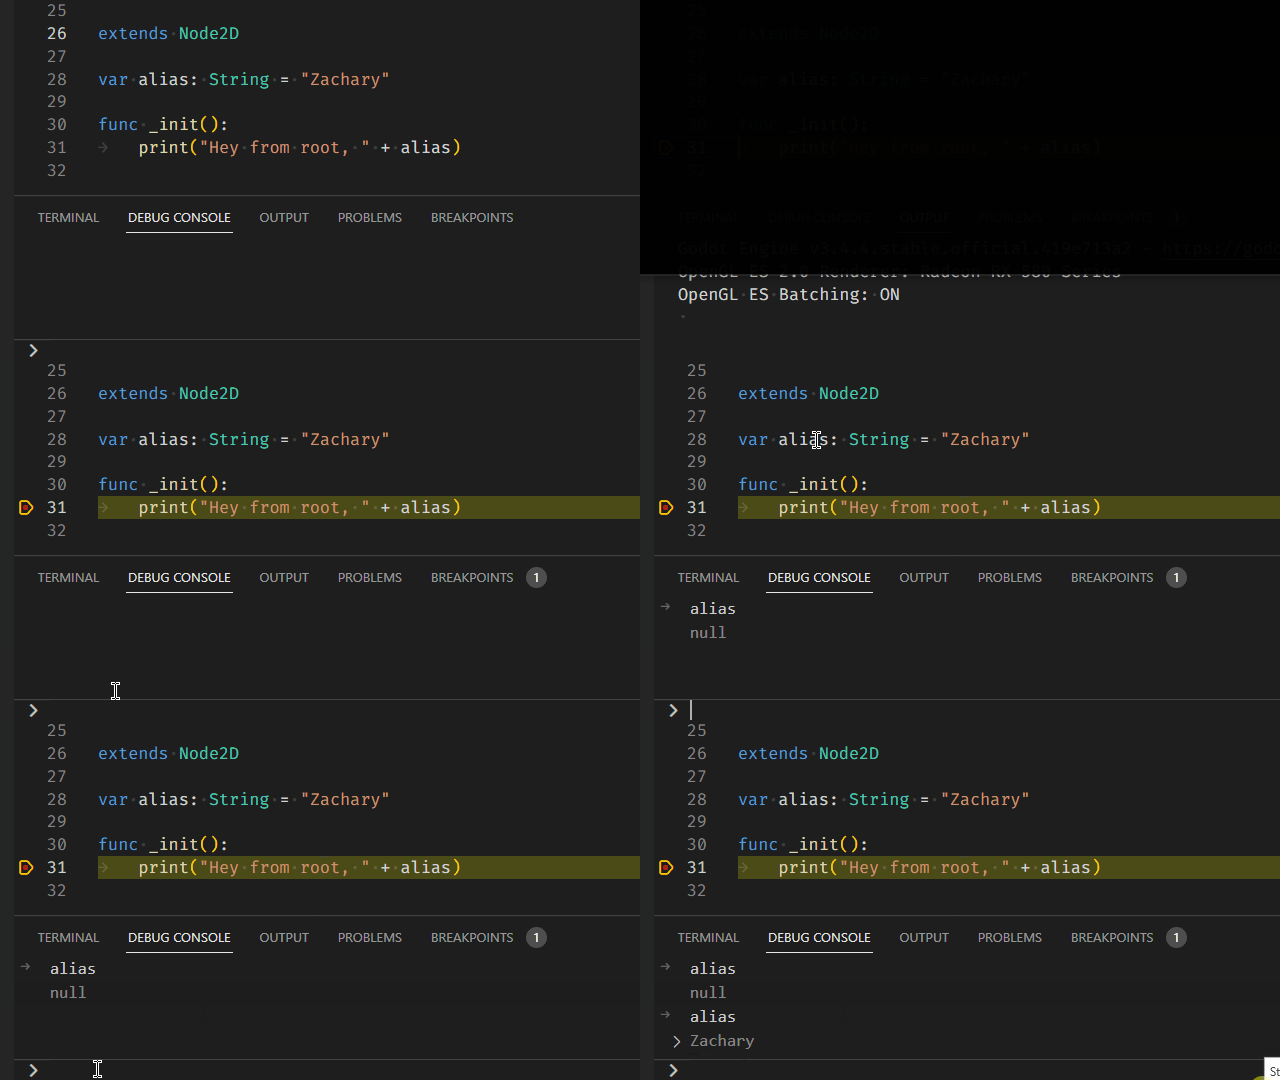
Debug Console only shows variable's correct value after hovering it
Godot version
3.4.4.stable
VS Code version
1.68.0
Godot Tools VS Code extension version
1.3.1
System information
Windows 10
Issue description
As you can see in the gif below the Debug Console doesn't reliably show the correct value of a variable. Only after highlighting a variable with the mouse will it show the correct value.

Steps to reproduce
- Place breakpoint in VS Code
- Run project
- After hitting breakpoint type in a name of a variable in the Debug Console (it will be wrong)
- Highlight the variable with your mouse
- Typing the variable again will give you the correct value
Inspecting Variables
- [x] Inspecting all variables types
- [x] "Could not find: ${entered_variable}"
Built-In Types
- [x] bool
- [x] int
- [x] float
- [x] String
Vector Built-In Types
- [x] Vector2
- [x] Rect2
- [x] Vector3
- [x] Transform3D
- [x] Plane
- [x] Quat
- [x] AABB
- [x] Basis
- [x] Transform2D
Engine Built-In Types
- [x] Color
- [x] NodePath
- [x] RID
- [x] Object
Container Built-In Types
- [x] Array
- [x] Dictionary
I have a branch that I'm cleaning up that just has the completed inspect changes. Perhaps I can make a pull request for just that when the it's ready.
https://github.com/ZachIsAGardner/godot-vscode-plugin/tree/debug-console-inspect
@ZachIsAGardner Does this behavior look right to you?
When I re-implemented your PRs in my debugger rewrite, I was so in the weeds getting the basic functionality to work that I didn't really validate your debug console features.
@DaelonSuzuka from what i can tell in the gif it looks right! you didn't have to highlight the variable "b" to get it to return the correct variable in the debug console, which is the problem i was experiencing.
Excellent! There was quite a large gap between when I rolled your PRs into my debugger rewrite and when I finally had the damn thing working well enough to test it, and by that time I kind of forgot what code came from your features and what I'd rewritten.