go-carbon
 go-carbon copied to clipboard
Not always getting data from cache, Whisper workers, Disable logging of metrics?
Hi,
We have a quite large Graphite setup that used to be multiple Python Relays and Carbon Caches. It's not migrated to the Go versions for simplicity - and performance. We have close to 2M incoming metrics (Pickle format only). By writing about 100points/update we manage to get the data down to disk in a reasonable time. We run in AWS c5.9xlarge (36vCPU and 72 GB RAM) and EBS storage with 25k IOPS. Queries are made through Python graphite-web (latest version), Gunicorn and NginX. 9s Memcached query-cache. We also use this system for monitoring by fetching data from it.
-
Sometimes we are missing the latest data, not just the last measurement - but a block of 10-15 minutes. I believe that this is data that is still in cache - and not yet written to disk. We see this both in Grafana - and in the monitoring system that analyses the data (NULL-values only). On the next reload - all the data is likely back and looking good. Any idea of what this can bee - and how to solve it - as it triggers a lot of our alerting systems. Is it a timeout somewhere - we never have to wait for any of the data. Logging shows that is takes less than a millisecond to get the queried data in most cases. Even when empty data is returned. Alternative frontends? Carbonapi or other interfaces (grpc)? Is it the cache or the web-front that fails?
-
Given the large amount of metric data, number of CPU's and RAM, I have tried to follow the guides on max-cpu and worker settings (~1/2 of cpu). I also read about those that has twice the workers compared to CPU. I have some NginX process shuffling data out to our new data-collection hosts (CollectD and Carbon-relay-ng) - and then it comes back again. So I have tried max-cpu 34 and whisper workers=30. Then the process used ~10GB of RAM. I also tried max-cpu 30 and 16 workers, Then it uses 27 GB RAM - but always stabilised with about 100M metrics in cache. Is there another recommendation if you run on large servers? Does it matter much that other things are also using little of the CPUs.
-
In my go-carbon.log I have all the stats-metrics written. They are collected and graphed - so I don't need them in the log - as that may just hide other important messages. What to I add in the config to disable them in the logs? I have tried to set logging level to "warn" instead of "info" but that did not change anything. Example log entry: [2020-09-17T18:07:57.476Z] INFO [stat] collect {"endpoint": "local", "metric": "carbon.agents.stats.grpc.cacheResponseMetrics", "value": 0}
I know this was a lot of questions at once - but I hope that someone can give me a hint in the right direction or share some of their experiences.
Regards, Johan
Can you please share go-carbon's config and grahite-web's config file and maybe explain your setup in a bit more details?
I have added some images in my google account: https://photos.app.goo.gl/GyK2dgFguuw6gKjH9
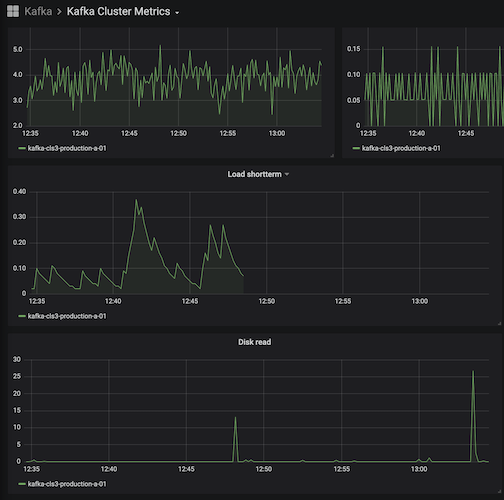
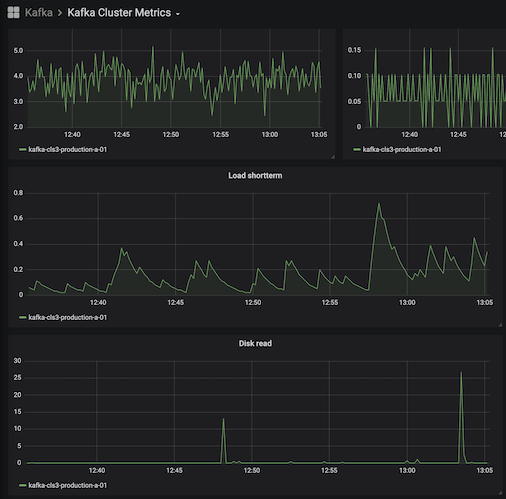
Carbon Dashboard, The Kafka examples with missing data and a Draw.io sketch of our setup.
Examples of Kafka dashboards where the last data is missing from one graph. It's 13s between them, and it did show data before as well - just took the snapshot when the data disappeared - and then after a reload again.


# New Go-carbon config options.

[common]

# Run as user. Works only in daemon mode
user = "graphite"
# Prefix for store all internal go-carbon graphs. Supported macroses: {host}
graph-prefix = "carbon.agents.{host}"
#graph-prefix = "stats.carbon.agents.stats-go"
# Endpoint for store internal carbon metrics. Valid values: "" or "local", "tcp://host:port", "udp://host:port"
metric-endpoint = "local"
# Interval of storing internal metrics. Like CARBON_METRIC_INTERVAL
#metric-interval = "1m0s"
metric-interval = "10s"
# Increase for configuration with multi persister workers
#max-cpu = 18
# When fully migrated (and on a c5.9xlarge)
max-cpu = 34

[whisper]
data-dir = "/data/graphite/whisper"
# http://graphite.readthedocs.org/en/latest/config-carbon.html#storage-schemas-conf. Required
schemas-file = "/etc/go-carbon/storage-schemas.conf"
# http://graphite.readthedocs.org/en/latest/config-carbon.html#storage-aggregation-conf. Optional
aggregation-file = "/etc/go-carbon/storage-aggregation.conf"
# Worker threads count. Metrics sharded by "crc32(metricName) % workers"
# workers = 10
# When fully migrated, (half of max-cpu)
workers = 28

# Limits the number of whisper update_many() calls per second. 0 - no limit
max-updates-per-second = 2500
# Softly limits the number of whisper files that get created each second. 0 - no limit
max-creates-per-second = 10
# Make max-creates-per-second a hard limit. Extra new metrics are dropped. A hard throttle of 0 drops all new metrics.
hard-max-creates-per-second = false
# Sparse file creation
sparse-create = false
# use flock on every file call (ensures consistency if there are concurrent read/writes to the same file)
flock = true
enabled = true
# Use hashed filenames for tagged metrics instead of human readable
# https://github.com/go-graphite/go-carbon/pull/225
hash-filenames = false
# specify to enable/disable compressed format (EXPERIMENTAL)
# See details and limitations in https://github.com/go-graphite/go-whisper#compressed-format
# IMPORTANT: Only one process/thread could write to compressed whisper files at a time, especially when you are
# rebalancing graphite clusters (with buckytools, for example), flock needs to be enabled both in go-carbon and your tooling.
compressed = false
# automatically delete empty whisper file caused by edge cases like server reboot
remove-empty-file = false

[cache]
# Limit of in-memory stored points (not metrics)
max-size = 200000000
# Capacity of queue between receivers and cache
# Strategy to persist metrics. Values: "max","sorted","noop"
#   "max" - write metrics with most unwritten datapoints first
#   "sorted" - sort by timestamp of first unwritten datapoint.
#   "noop" - pick metrics to write in unspecified order,
#            requires least CPU and improves cache responsiveness
write-strategy = "noop"

[udp]
listen = ":2413"
enabled = true
# Optional internal queue between receiver and cache
buffer-size = 0

[tcp]
listen = ":2413"
enabled = true
# Optional internal queue between receiver and cache
buffer-size = 0

[pickle]
listen = ":2414"
# Limit message size for prevent memory overflow
max-message-size = 67108864
enabled = true
# Optional internal queue between receiver and cache
buffer-size = 0
[carbonlink]
#listen = "127.0.0.1:7412"
listen = ":7412"
enabled = true
# Close inactive connections after "read-timeout"
read-timeout = "30s"

# grpc api
# protocol: https://github.com/go-graphite/go-carbon/blob/master/helper/carbonpb/carbon.proto
# samples: https://github.com/go-graphite/go-carbon/tree/master/api/sample
[grpc]
#listen = "127.0.0.1:7403"
listen = ":7403"
enabled = true

..... all defaults.
# Default logger
[[logging]]
# logger name
# available loggers:
# * "" - default logger for all messages without configured special logger
# @TODO
logger = ""
# Log output: filename, "stderr", "stdout", "none", "" (same as "stderr")
file = "/data/graphite/log/carbon/go-carbon.log"
# Log level: "debug", "info", "warn", "error", "dpanic", "panic", and "fatal"
level = "info"
# Log format: "json", "console", "mixed"
encoding = "mixed"
# Log time format: "millis", "nanos", "epoch", "iso8601"
encoding-time = "iso8601"
# Log duration format: "seconds", "nanos", "string"
encoding-duration = "seconds"
And the web-config (local_settings.py)
# http://graphite.readthedocs.org/en/latest/config-local-settings.html
SECRET_KEY = "****"
TIME_ZONE = "Etc/UTC"
MEMCACHE_HOSTS = ["127.0.0.1:11211"]
DEFAULT_CACHE_DURATION = 9
STORAGE_DIR = "/data/graphite"
WHISPER_DIR = "/data/graphite/whisper"
CARBONLINK_HOSTS = [
    "127.0.0.1:7412:m",
]
FIND_TIMEOUT = 60
FETCH_TIMEOUT = 60
FIND_CACHE_DURATION = 60
We use to have 9 Carbon-relays and 13 Carbon-caches (a-l) running on this node before, now the load is distributed to 2 new data-collection nodes - but data still goes in to this - and then out and back. (~600 Mbits in and ~230Mbits out) Seems like its working better during daytime (for unknown reason) - Maybe the physical host is less loaded? But how can we not get data all the time? Looks like it's the same metrics that are problematic all the time - so I think that it may be a shard with the cached data. The missing graph-data is not a problem - as it's just a matter of reload - but our alerting system triggers when we don't have any data for a service - or when the aggregated numbers over several servers suddenly don't add up as it should.
/Johan
We have now migrated the Go-carbon, CarbonAPI, and Graphite-Web to a new server Which is now running Ubuntu 18.04, and all the latest available components. It seems to be a bit more stable - but still we have occasional dropouts of the last (unwritten?) data in the query (/render) results. I will investigate more now that we are on a up-to-date system so we can't just blame to outdated system for everything.
Regarding Issue 3) The log config. It does work fine - the issue I had was that a "systemctl reload go-carbon" did not have immediate effect, but after a real restart - there were no info entries in the logs any more.
@JohanElmis : v0.15.3 was released, including fix for panic. You can test did it help for your case. I opened issue for HUP reload issue.
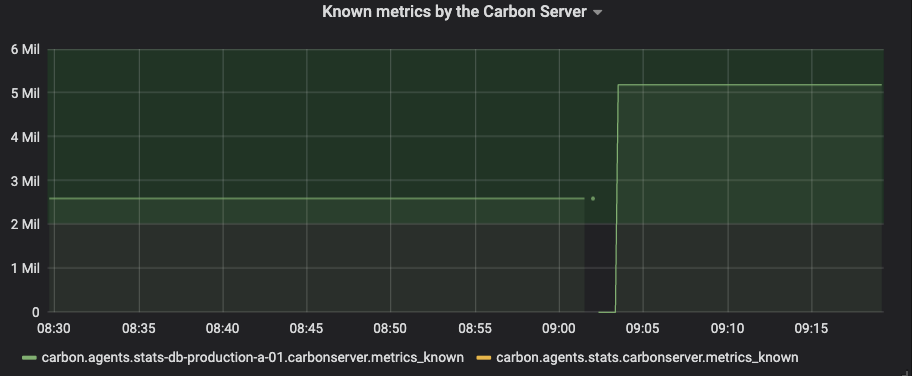
@deniszh Just released the new v0.15.4 to our production setup. It will take some time before I can see if the open-files are still increasing or not. I did however notice that the "Known metrics" doubled with the upgrade. That seems strange.
 Known metrics doubled when going from 0.15.0 to 0.15.4.
I can also see the same doubling of known metrics when running 0.15.4
Hi @JohanElmis @nikobearrr are you using any of the new features, like trie-index, concurrent-index, realtime-index or cache-scan?
In theory, should just be a stat issue, shouldn't cause data issues.
Hi @bom-d-van I am not using those, or at least not that I know of. I am using go-carbon through the docker-graphite-statsd graphite with the default config which can be found here: https://github.com/graphite-project/docker-graphite-statsd/blob/405db0baee70b50ee89631f60664c5a2fec650db/conf/opt/graphite/conf/go-carbon.conf
Hi @nikobearrr , I have found the issue, it's introduced in v0.15.3 for two of the new features for trie-index. I have pushed a fix: https://github.com/go-graphite/go-carbon/pull/385
Hi @nikobearrr @JohanElmis , @deniszh just help us released v0.15.5 for the fix.
@bom-d-van @deniszh Thanks for your fast response. Version 0.15.5 is now running in our production environment and things are looking great. No increase in OpenFiles for the last 24h, (steady at ~45 in our setup.) The metric count (known metrics) is now back to the old value again. I can't say for sure that the gaps (last X minutes) are gone or not - but we have re-done our whole setup during the time as well. Feel free to close this ticket. Thanks again for a great product.