carbonapi
 carbonapi copied to clipboard
[Performance] Best practices for running carbonapi in K8s
Problem description We are transitioning from python to go stack. I am looking for some best practices for a good start. We are sending approx 1M metrics per second.. We use sumSeriesWithWildcards function a lot to do the aggregation across approx 1K directories on each graphite node which makes accumulative result coming from 3K directories.
Currently I am using this conf to read the data from three K8 services. Each upsteam entry is a K8s service with two go-graphite PODs.
listen: "0.0.0.0:8081"
concurency: 20
cache:
  # Type of caching. Valid: "mem", "memcache", "null"
  type: "mem"
upstreams:
  backendsv2:
    backends:
      -
        protocol: "carbonapi_v3_pb"
        lbMethod: "broadcast"
        servers:
          - "http://go-graphite-svc-node1:8080"
          - "http://go-graphite-svc-node2:8080"
          - "http://go-graphite-svc-node3:8080"
graphite:
  host: "172.16.32.11:2003"
  interval: "60s"
  prefix: "carbon.api"
  pattern: "{prefix}.{fqdn}"
I will change the concurrency limit based on https://github.com/go-graphite/carbonapi/blob/main/doc/configuration.md#concurency
currently I am allocating 2cpus and 4GB of memory for carbonapi instances .. Running three of them on same node. How we can control the number of workers in carbonapi POD based on cpu cores allocated to POD? Also do we have any ballpark figure on the number of carbonapi instances or the resources which we should allocate for carbonapi POD?
Also where we can find the other supported headers which we can log. Like if user is directly querying user curl API can we get the user name passed in header.
I have three instances of carbonapi running behind the K8s service. I am seeing unequal distribution of traffic across these 3 instances.
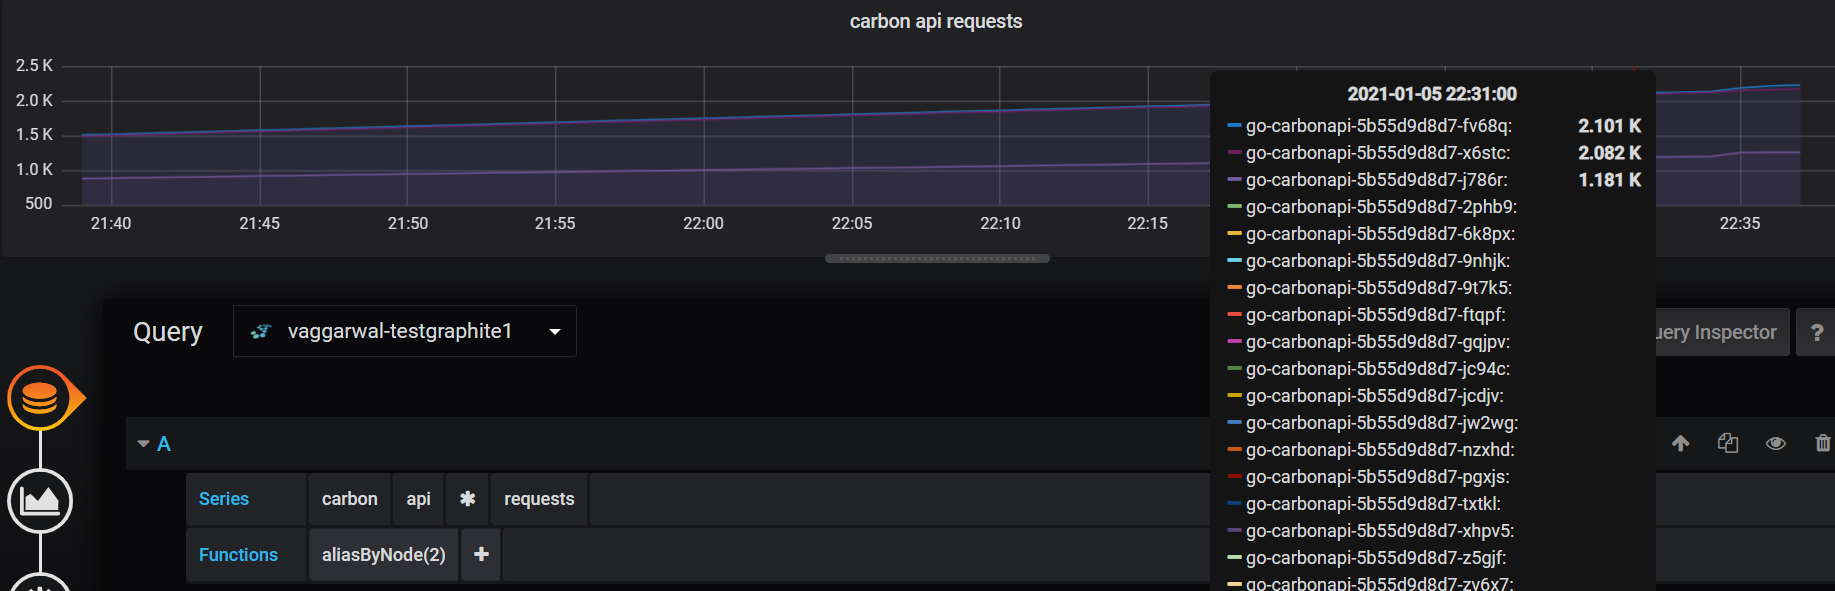
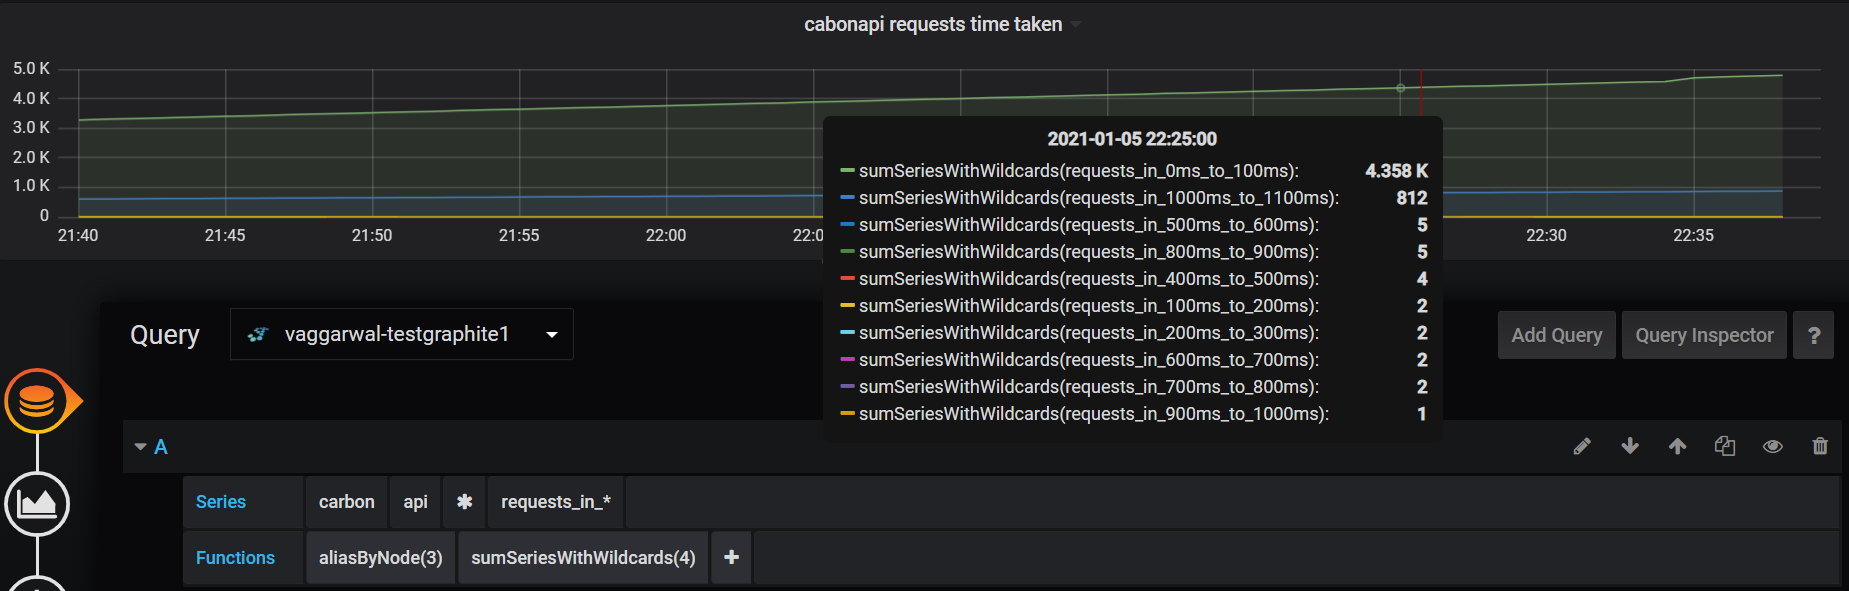
If I am looking at the time taken by all three carbonapi instances I see many requestes are taking more than 1s for completion.
We are sending approx 6M to 7M metrics per minute and running queries like this from grafana. Where first wildcard () represents 1100+ directories and then each directory can contains 100 of sub directories which are represented by second wildcard () character. Performance is very slow (sometimes take forever :( ) in rendering grafana panels. Good thing is at-least it's not getting timedout which it usually do with python-web.
aliasByNode(sumSeriesWithWildcards(removeEmptySeries(dir1.dir2.sitename.clients..RET_30s1d_1m30d_5m90d.dir4..read.bytes), 4), 6)
Tried to introduce the memcached component to increase the caching it doesn't help. Any other tuning setting recommended for carbonapi or carbonzipper.
We average about 8.5M merics per minute and although not k8s it is a high cardinality data set as we receive metrics from almost 1000 different microservices running on AWS ECS. Each microservice can have many instances and can redeployed multiple times a day, each time with a unique container name.
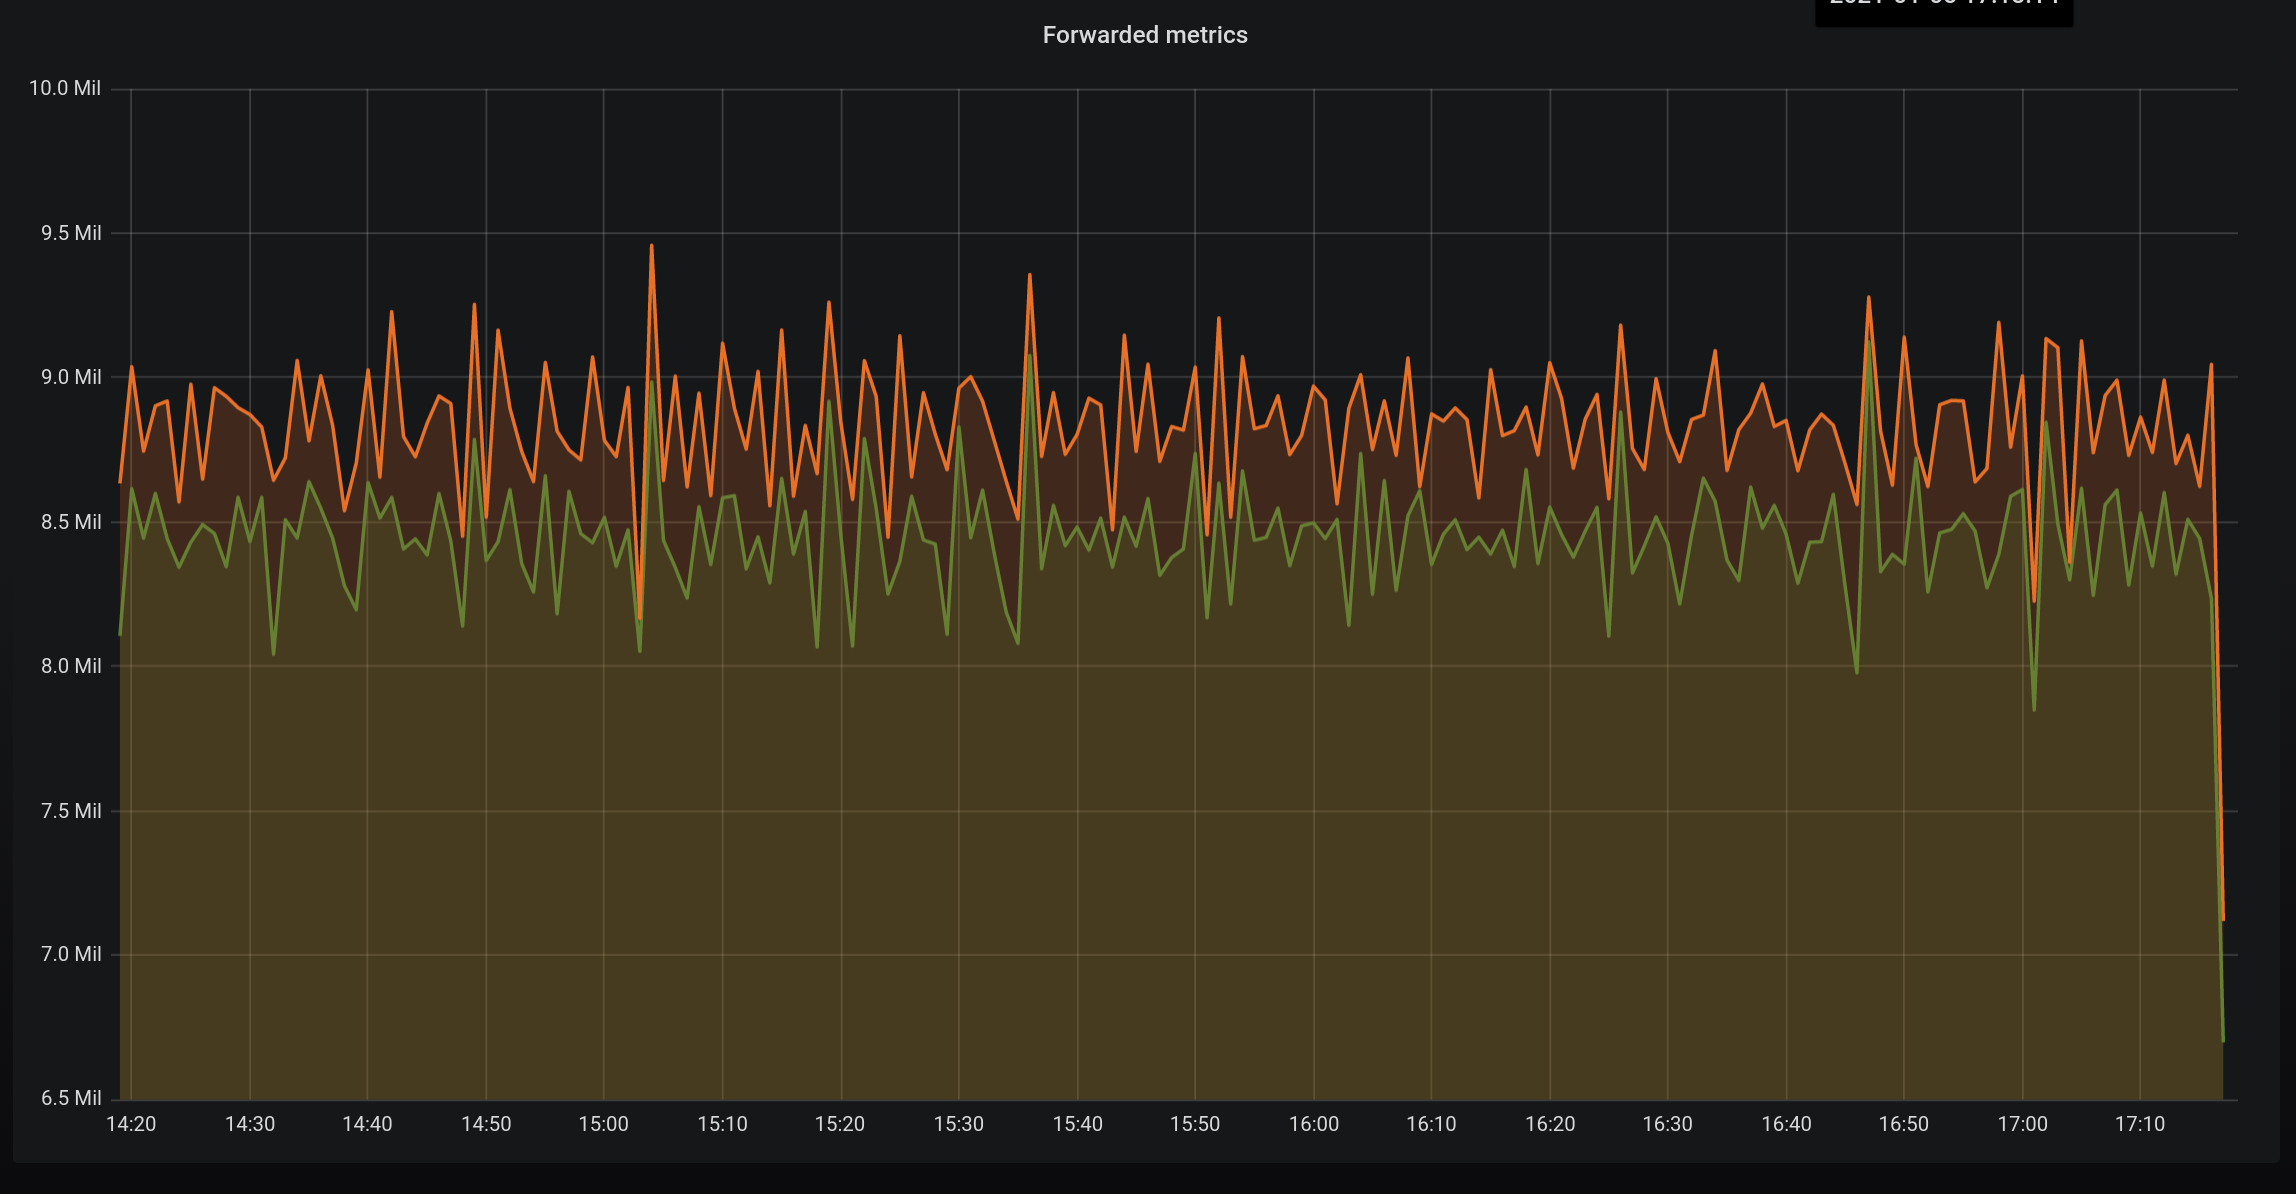 Some JVM metrics are dropped and others aggregated so the inbound to our routing layer (orange) is higher than the output (red).
We were not able to scale to this level using whisper files on disk. Well, maybe we could have done but the infrastructure needed to do so and the automations needed to make it reliable frankly scared us.
Clickhouse is a really nice distributed sql database that we have found very performant as a graphite style data store when combined with Graphite-clickhouse and Carbon-clickhouse.
If you are having problems with query speed during the fetch phase and issues with load balancing I strongly recommend looking at this alternative stack.
Of course it is compatible with carbon api :smile:
thanks. I will take a look.
Ya graphite doesn't look to be a suitable option here.
{"level":"WARN","timestamp":"2021-01-05T17:54:48.989Z","logger":"slow","message":"Slow Request","time":3.924905977,"url":"/render","referer":""}
{"level":"WARN","timestamp":"2021-01-05T17:54:49.502Z","logger":"slow","message":"Slow Request","time":3.988019433,"url":"/render","referer":""}
{"level":"WARN","timestamp":"2021-01-05T17:56:00.988Z","logger":"slow","message":"Slow Request","time":3.910490497,"url":"/render","referer":""}
{"level":"WARN","timestamp":"2021-01-05T17:56:01.380Z","logger":"slow","message":"Slow Request","time":3.866177811,"url":"/render","referer":""}
{"level":"ERROR","timestamp":"2021-01-05T17:56:02.088Z","logger":"access","message":"request failed","data":{"handler":"render","carbonapi_uuid":"411e8e57-28bf-4441-baa5-70178d7604f5","url":"/render","peer_ip":"172.16.12.0","host":"xx.xx.xx.xx:80","format":"json","use_cache":true,"targets":["aliasByNode(sumSeriesWithWildcards(removeEmptySeries(gpfs.gpfs2graphite.test.clients.*.RET_30s1d_1m30d_5m90d.d_state.*), 4), 6)"],"cache_timeout":60,"runtime":78.505768494,"http_code":500,"reason":"error or no response: no metrics in the Response","from":1609868983,"until":1609869283,"from_raw":"-5min","until_raw":"now","uri":"/render","from_cache":false,"used_backend_cache":false,"request_headers":{}}}
This was my conf.
listen: "0.0.0.0:8081"
concurency: 1000
cache:
  # Type of caching. Valid: "mem", "memcache", "null"
  type: "mem"
  # Cache limit in megabytes
  #size_mb: 0
  ## Default cache timeout value. Identical to DEFAULT_CACHE_DURATION in graphite-web.
  #defaultTimeoutSec: 60
  ## Only used by memcache type of cache. List of memcache servers.
  #memcachedServers:
  #    - "my-memcache-memcached.ns-vaggarwal.svc.cluster.local:11211"
upstreams:
  backendsv2:
    backends:
      -
        protocol: "carbonapi_v3_pb"
        lbMethod: "broadcast"
        maxTries: 3
        maxGlobs: 2000
        keepAliveInterval: "10s"
        concurrencyLimit: 0
        maxIdleConnsPerHost: 1000
        timeouts:
            find: "2s"
            render: "50s"
            connect: "200ms"
        servers:
          - "http://go-graphite-svc-node1:8080"
          - "http://go-graphite-svc-node2:8080"
          - "http://go-graphite-svc-node3:8080"