Cache of unavailable metrics
Problem description I have 2 go-carbon clusters in different DCs. To see metrics from applications from different DCs in one Grafana dashboard, I added carbonapi in the second DC as a backend to carbonapi in the first DC. Since in carbonapi lbMethod: "broadcast" go-carbon from the second DC accepts a lot of requests from the first DC and cannot find metrics, since they are not there.
carbonapi's version 0.14.1
carbonapi's config from first DC
listen: "0.0.0.0:8081"
concurency: 30
cpus: 0
tz: ""
functionsConfig:
    graphiteWeb: /etc/carbonapi/graphiteWeb.yaml
maxBatchSize: 300
graphite:
    host: ""
    interval: "60s"
    prefix: "carbon.api"
    pattern: "{prefix}.{fqdn}"
idleConnections: 10
pidFile: "/var/run/carbonapi/carbonapi.pid"
upstreams:
    buckets: 10
    timeouts:
        find: "2s"
        render: "10s"
        connect: "200ms"
    concurrencyLimitPerServer: 0
    keepAliveInterval: "30s"
   maxIdleConnsPerHost: 100
    backends:
        - "http://10.0.1.131:8080"
        - "http://10.0.1.132:8080"
        - "http://10.0.1.133:8080"
        - "https://carbonapi.dc2"
    backendsv2:
        backends:
          -
            groupName: "group1"
            #
            protocol: "carbonapi_v2_pb"
            lbMethod: "broadcast"
            maxTries: 3
            maxGlobs: 100
            keepAliveInterval: "10s"
            concurrencyLimit: 0
            maxIdleConnsPerHost: 1000
            timeouts:
                find: "2s"
                render: "50s"
                connect: "200ms"
            servers:
                - "http://127.0.0.2:8080"
                - "http://127.0.0.3:8080"
          -
            groupName: "group2"
            protocol: "carbonapi_v3_pb"
            lbMethod: "roundrobin"
            servers:
                - "http://127.0.0.4:8080"
                - "http://127.0.0.5:8080"
    graphite09compat: true
graphTemplates: /etc/carbonapi/graphTemplates.yaml
expireDelaySec: 10
defaultColors:
      "red": "ff0000"
      "green": "00ff00"
      "blue": "#0000ff"
      "darkred": "#c80032"
      "darkgreen": "00c800"
      "darkblue": "002173"
logger:
    - logger: ""
      file: "/var/log/carbonapi.log"
      level: "warn"
      encoding: "json"
      encodingTime: "iso8601"
      encodingDuration: "seconds"
carbonapi's config from second DC
listen: "0.0.0.0:8081"
concurency: 1000
cpus: 0
tz: ""
maxBatchSize: 300
graphite:
    host: ""
    interval: "60s"
    prefix: "carbon.api"
    pattern: "{prefix}.{fqdn}"
idleConnections: 10
pidFile: "/var/run/carbonapi/carbonapi.pid"
upstreams:
    buckets: 10
    timeouts:
        find: "2s"
        render: "10s"
        connect: "200ms"
    concurrencyLimitPerServer: 0
    keepAliveInterval: "30s"
    maxIdleConnsPerHost: 100
    backendsv2:
        backends:
          -
            groupName: "go-carbon"
            protocol: "carbonapi_v3_pb"
            lbMethod: "broadcast"
            maxTries: 3
            maxGlobs: 100
            keepAliveInterval: "10s"
            concurrencyLimit: 0
            maxIdleConnsPerHost: 1000
            timeouts:
                find: "2s"
                render: "50s"
                connect: "200ms"
            servers:
                - "http://go-carbon-0.go-carbon.monitoring.svc.cluster.local:8080"
                - "http://go-carbon-1.go-carbon.monitoring.svc.cluster.local:8080"
                - "http://go-carbon-2.go-carbon.monitoring.svc.cluster.local:8080"
    graphite09compat: true
expireDelaySec: 10
defaultColors:
      "red": "ff0000"
      "green": "00ff00"
      "blue": "#0000ff"
      "darkred": "#c80032"
      "darkgreen": "00c800"
      "darkblue": "002173"
logger:
    - logger: "slow"
      file: "stdout"
      level: "warn"
      encoding: "json"
      encodingTime: "iso8601"
      encodingDuration: "seconds"
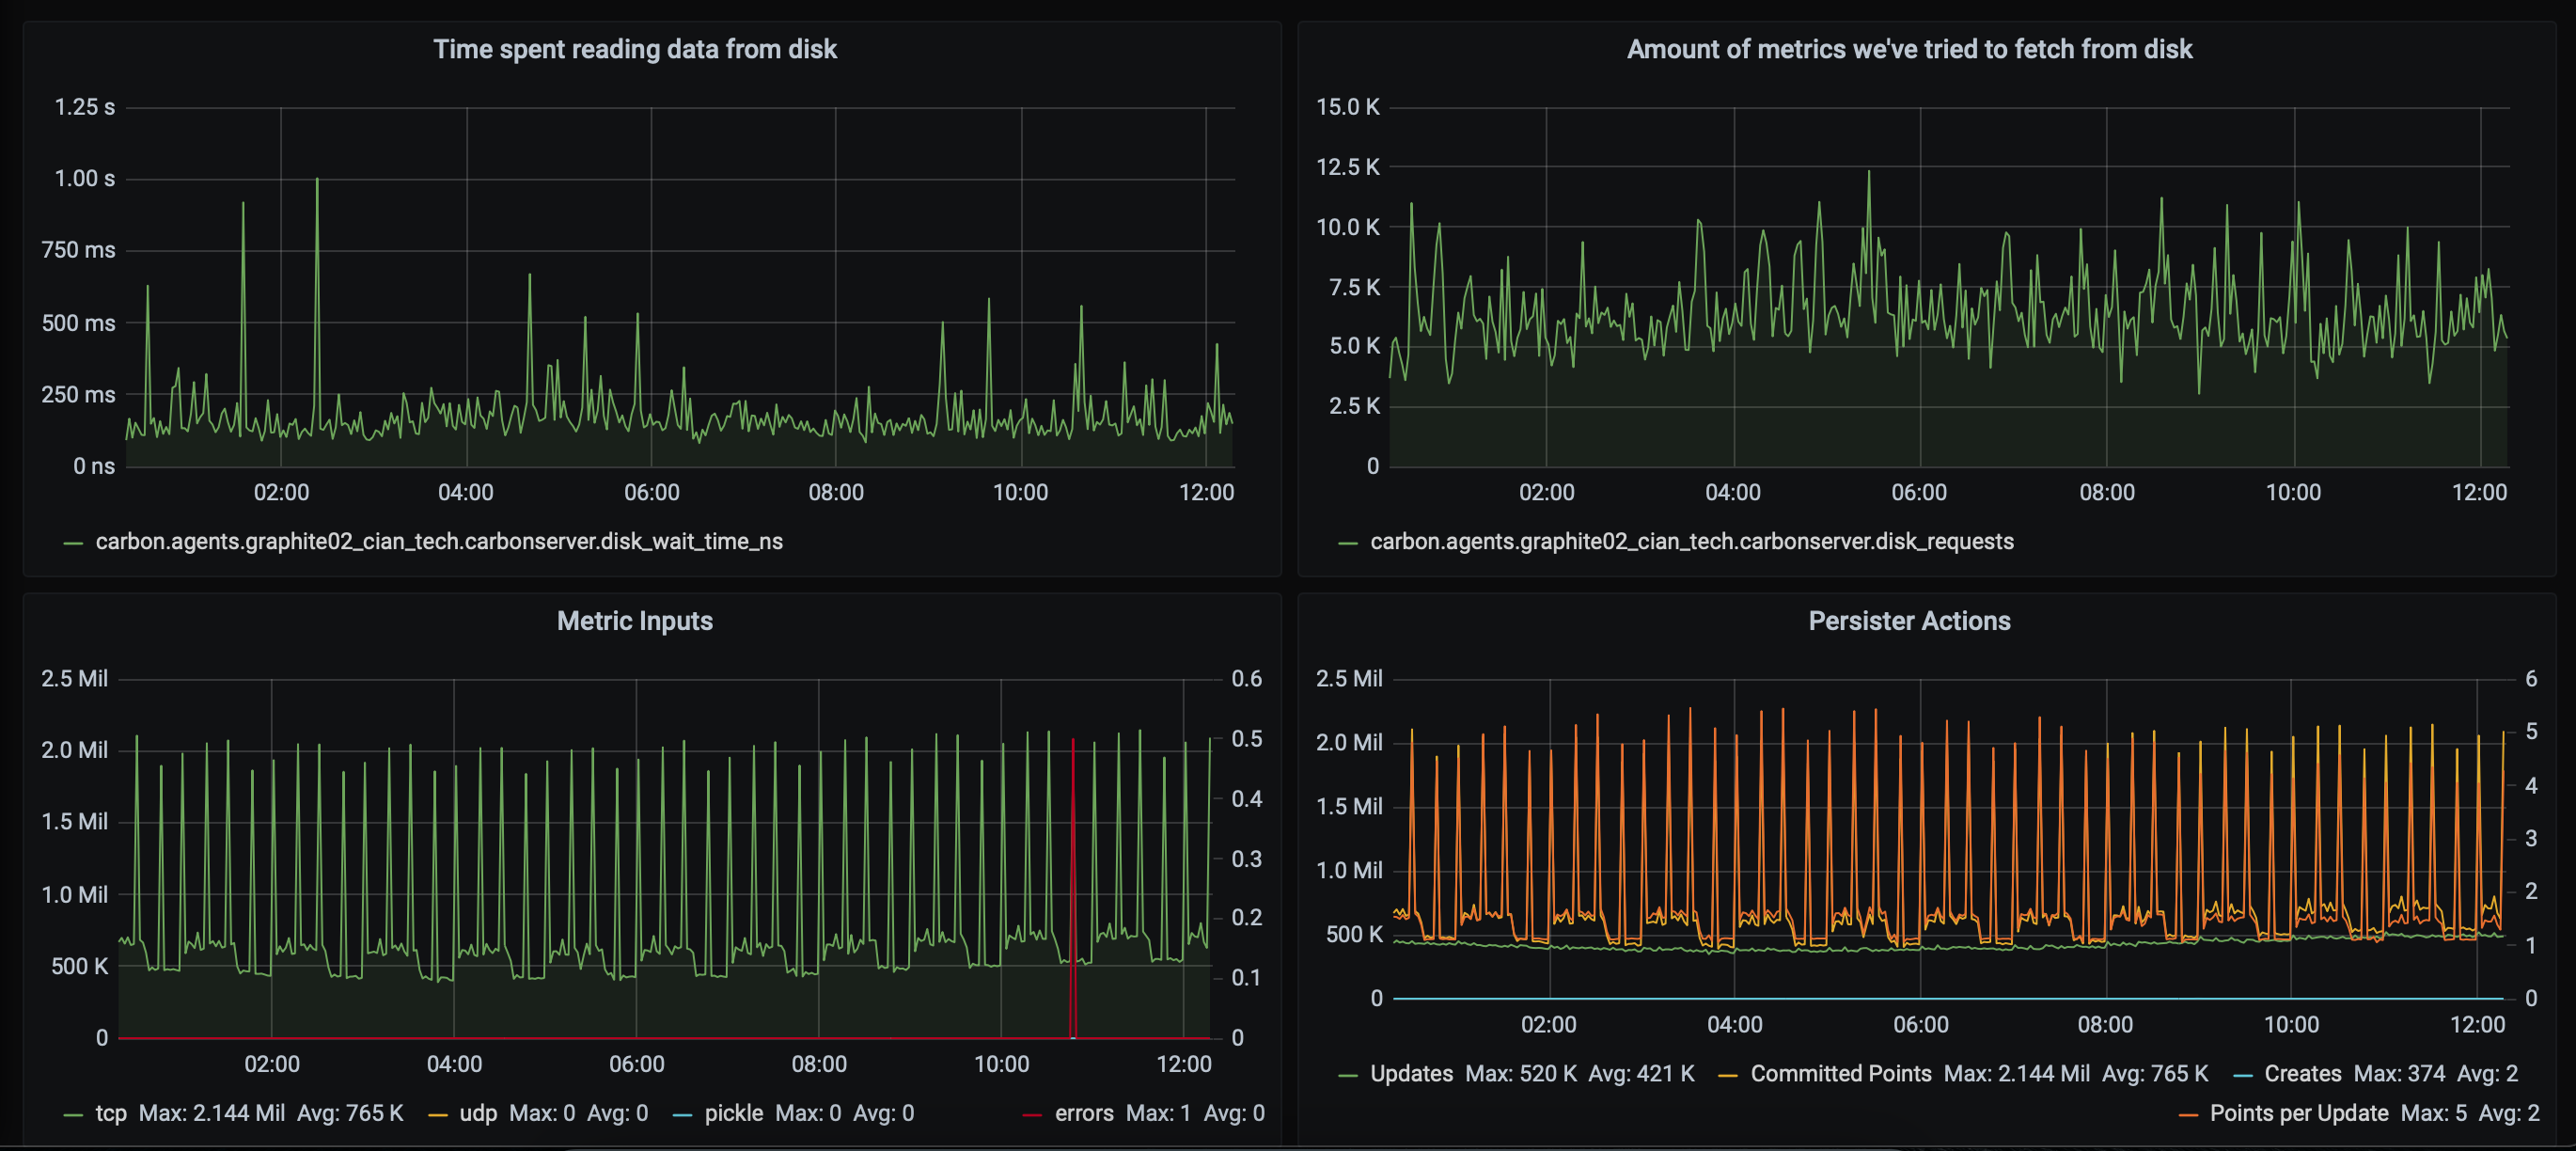
go-carbon in first DC
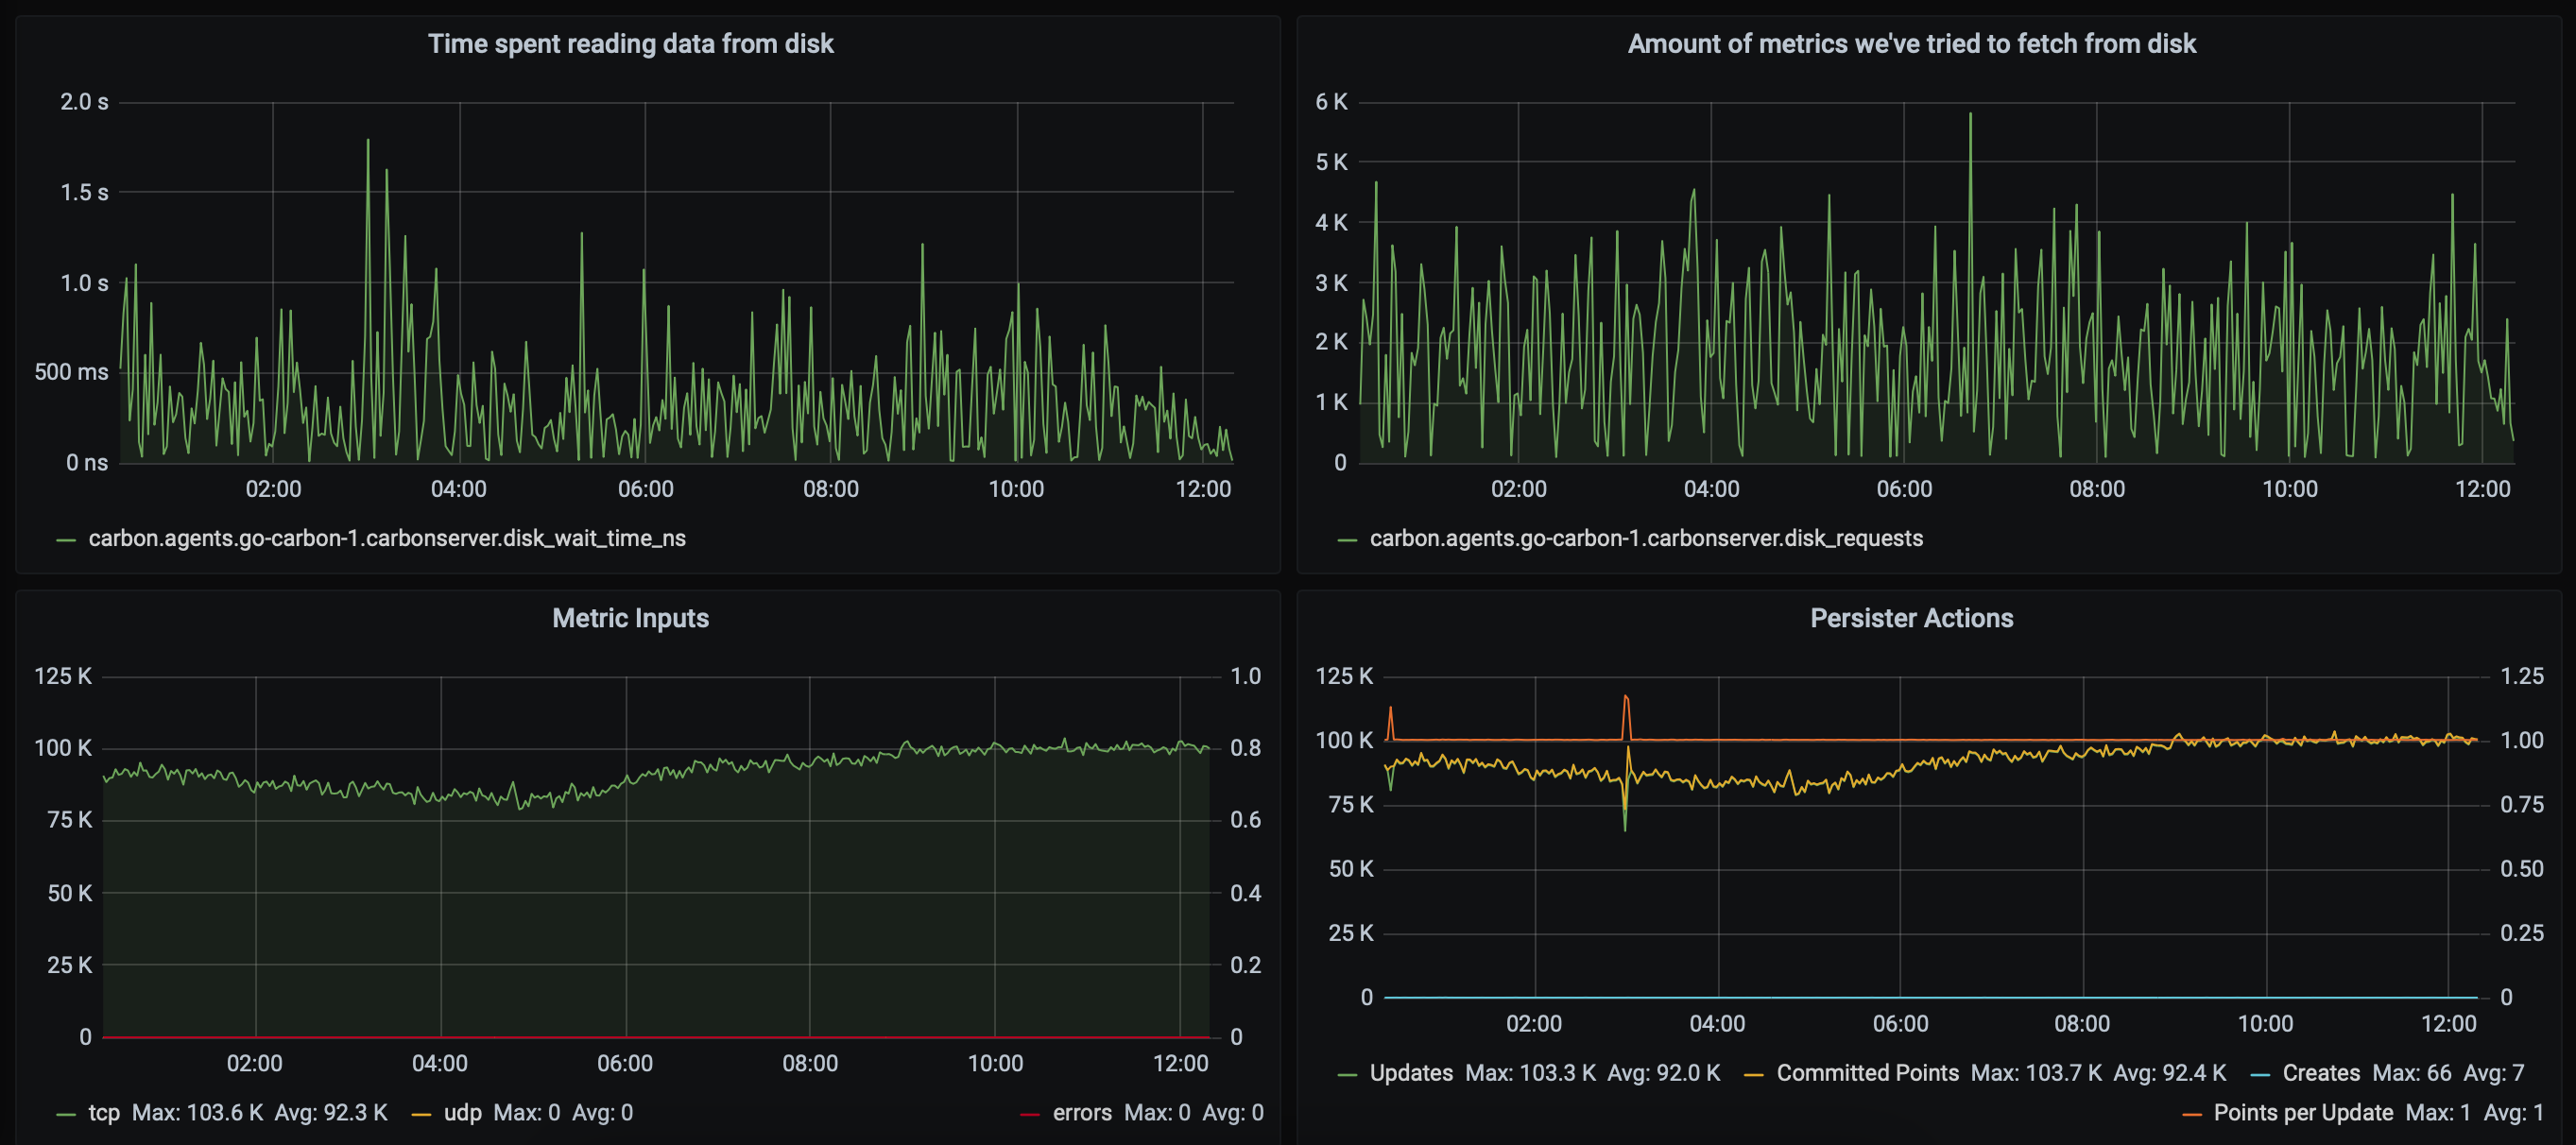
go-carbon in second DC
Question: is there a setting in carbonapi that will allow you not to search every time for a metric that is not there? can it cache the response?
Hi @radinv ,
Could you please describe tour setup in more detail? Config above is not really clear.
IIRC backend section is overriding any backendv2 section if both specified.
Theoretically, you just need to add go-carbon instances from both DCs as backends and use same config for both carbonapis.
@deniszh Thanks for the answer. My main database is in DC1. but in order to see 2 DCs at once for one datasource in grafan, I added carbonapi, which is in DC2 as a backend for carbonapi, which is in DC1.
        backends:
        - "http://10.0.1.131:8080"
        - "http://10.0.1.132:8080"
        - "http://10.0.1.133:8080"
        - "https://carbonapi.dc2"
Because of this, a lot of metrics requests come to carbonapi DC2, which are not there, since the request method is broadcast.
lbMethod: "broadcast"
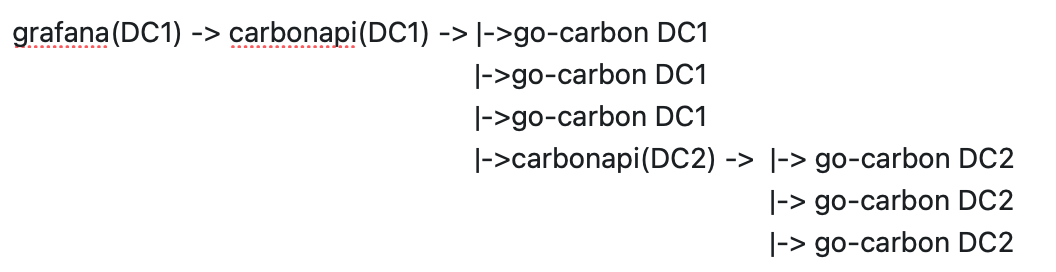
the chain of requests is as follows:
carbonapi DC1 has no slow logs. he gets quick metrics from go-carbon DC1. but carbonapi DC2 often gets timeout from go-carbon. it would be nice if carbonapi could remember for a while that there is no metric for a specific backend. I understand this is due to the speed of the go-carbon storage in DC2. but i cant increase it. also it seems to me that scaling to smaller pieces will have no effect
it would be nice if carbonapi could remember for a while that there is no metric for a specific backend.
No, that's not needed. Proper setup should look like this:
grafana(DC1) -> carbonapi(DC1) -> |-> go-carbon DC1
                                  |-> go-carbon DC1
                                  |-> go-carbon DC1
                                  |-> go-carbon DC2
                                  |-> go-carbon DC2
                                  |-> go-carbon DC2
carbonapi(DC2) is redundant and not needed at all.
I mean if issue is slowness in DC2 - then caching metrics will not help anyway. Find requests are cached in go-carbon for 5 minutes with find-cache-enabled = true.