Stripe: Create observability into the type, rate and return code of API calls we issue against Stripe
As it says in the title. An example is the metric gitpod_server_api_calls_total (link) from which we get insight into error rates, repsonse times and type of method called.
Implementation-wise (for Golang), we should use a HTTP Client tripper to compose an HTTP client which also exports metrics. See https://dev.to/stevenacoffman/tripperwares-http-client-middleware-chaining-roundtrippers-3o00 for examples
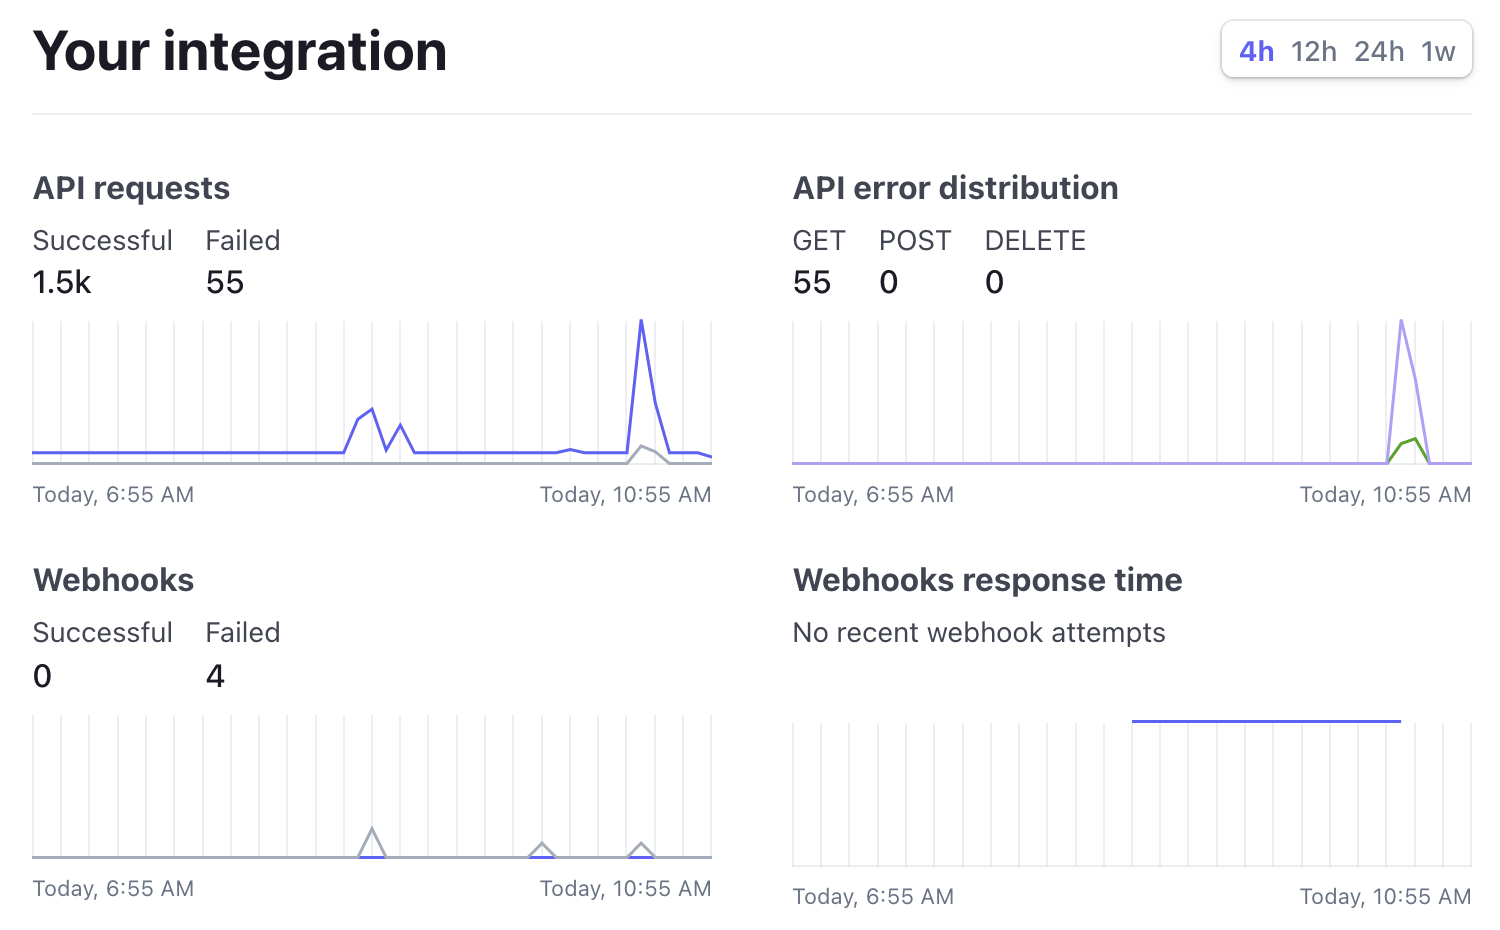
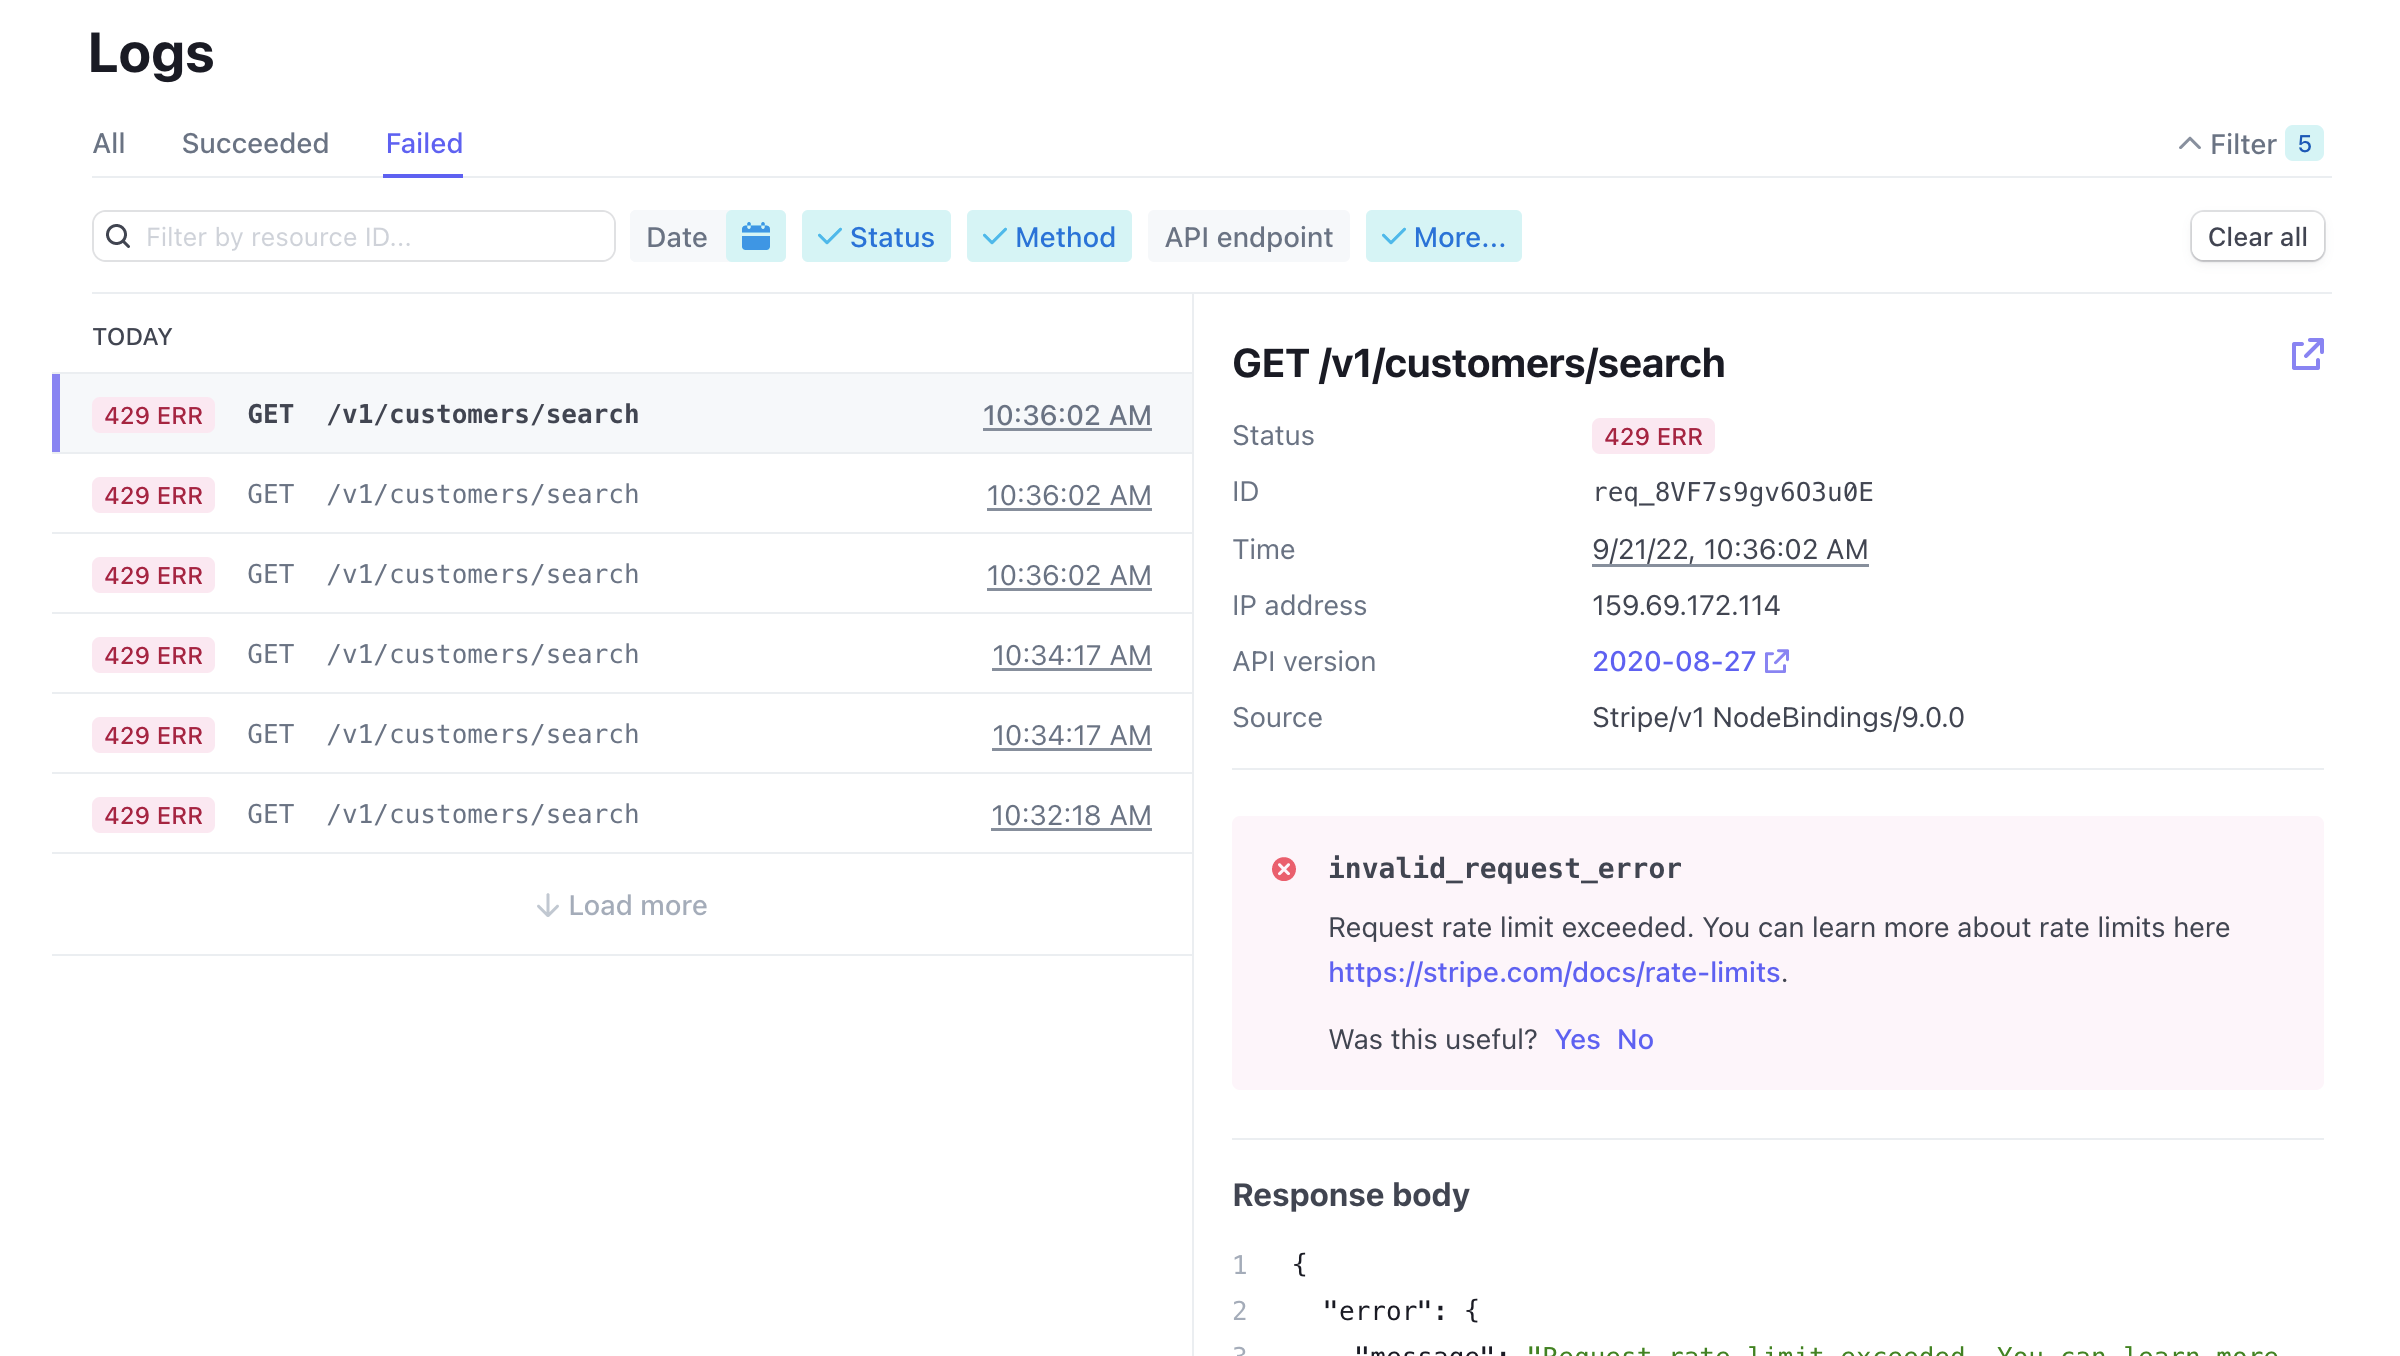
FYI, Stripe Dashboard > Developers already has this:
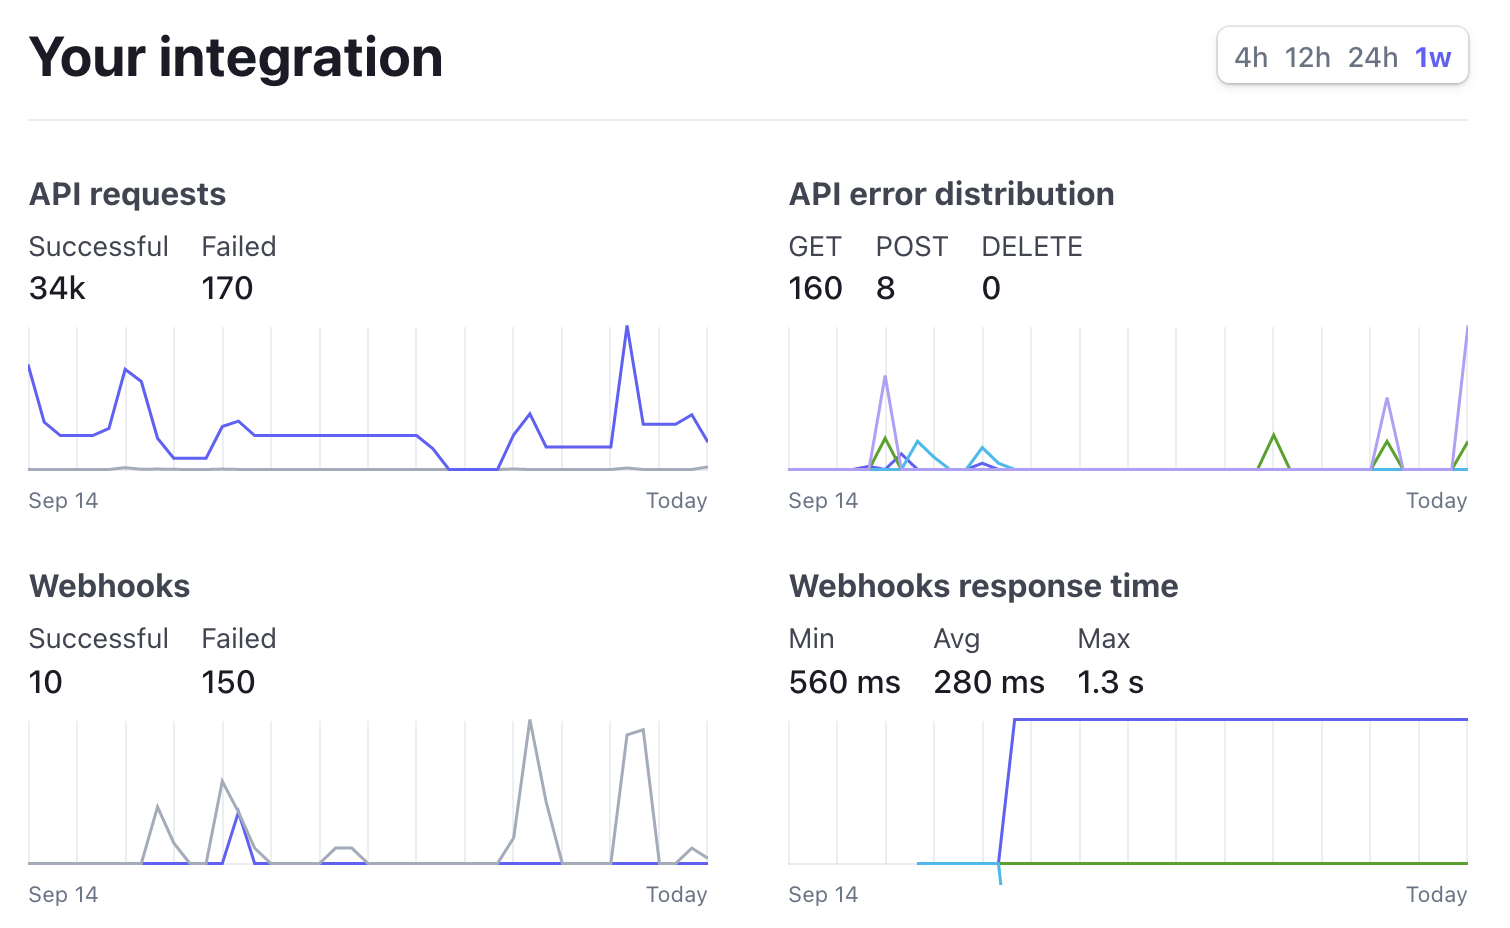
|
|
And you can drill down into the specific error codes:
Still seems worth implement the low-hanging parts on our end. a) Grafana is more flexible in displaying data, and b) we can build alerts with our common tools.
Still seems worth implement the low-hanging parts on our end. a) Grafana is more flexible in displaying data, and b) we can build alerts with our common tools.
Stripe will only have server metrics - for requests that actually reached it. If we fail to contact Stripe for whichever reason, we'd be blind - we need client side metrics also.
Metrics from server are coming through nicely on staging
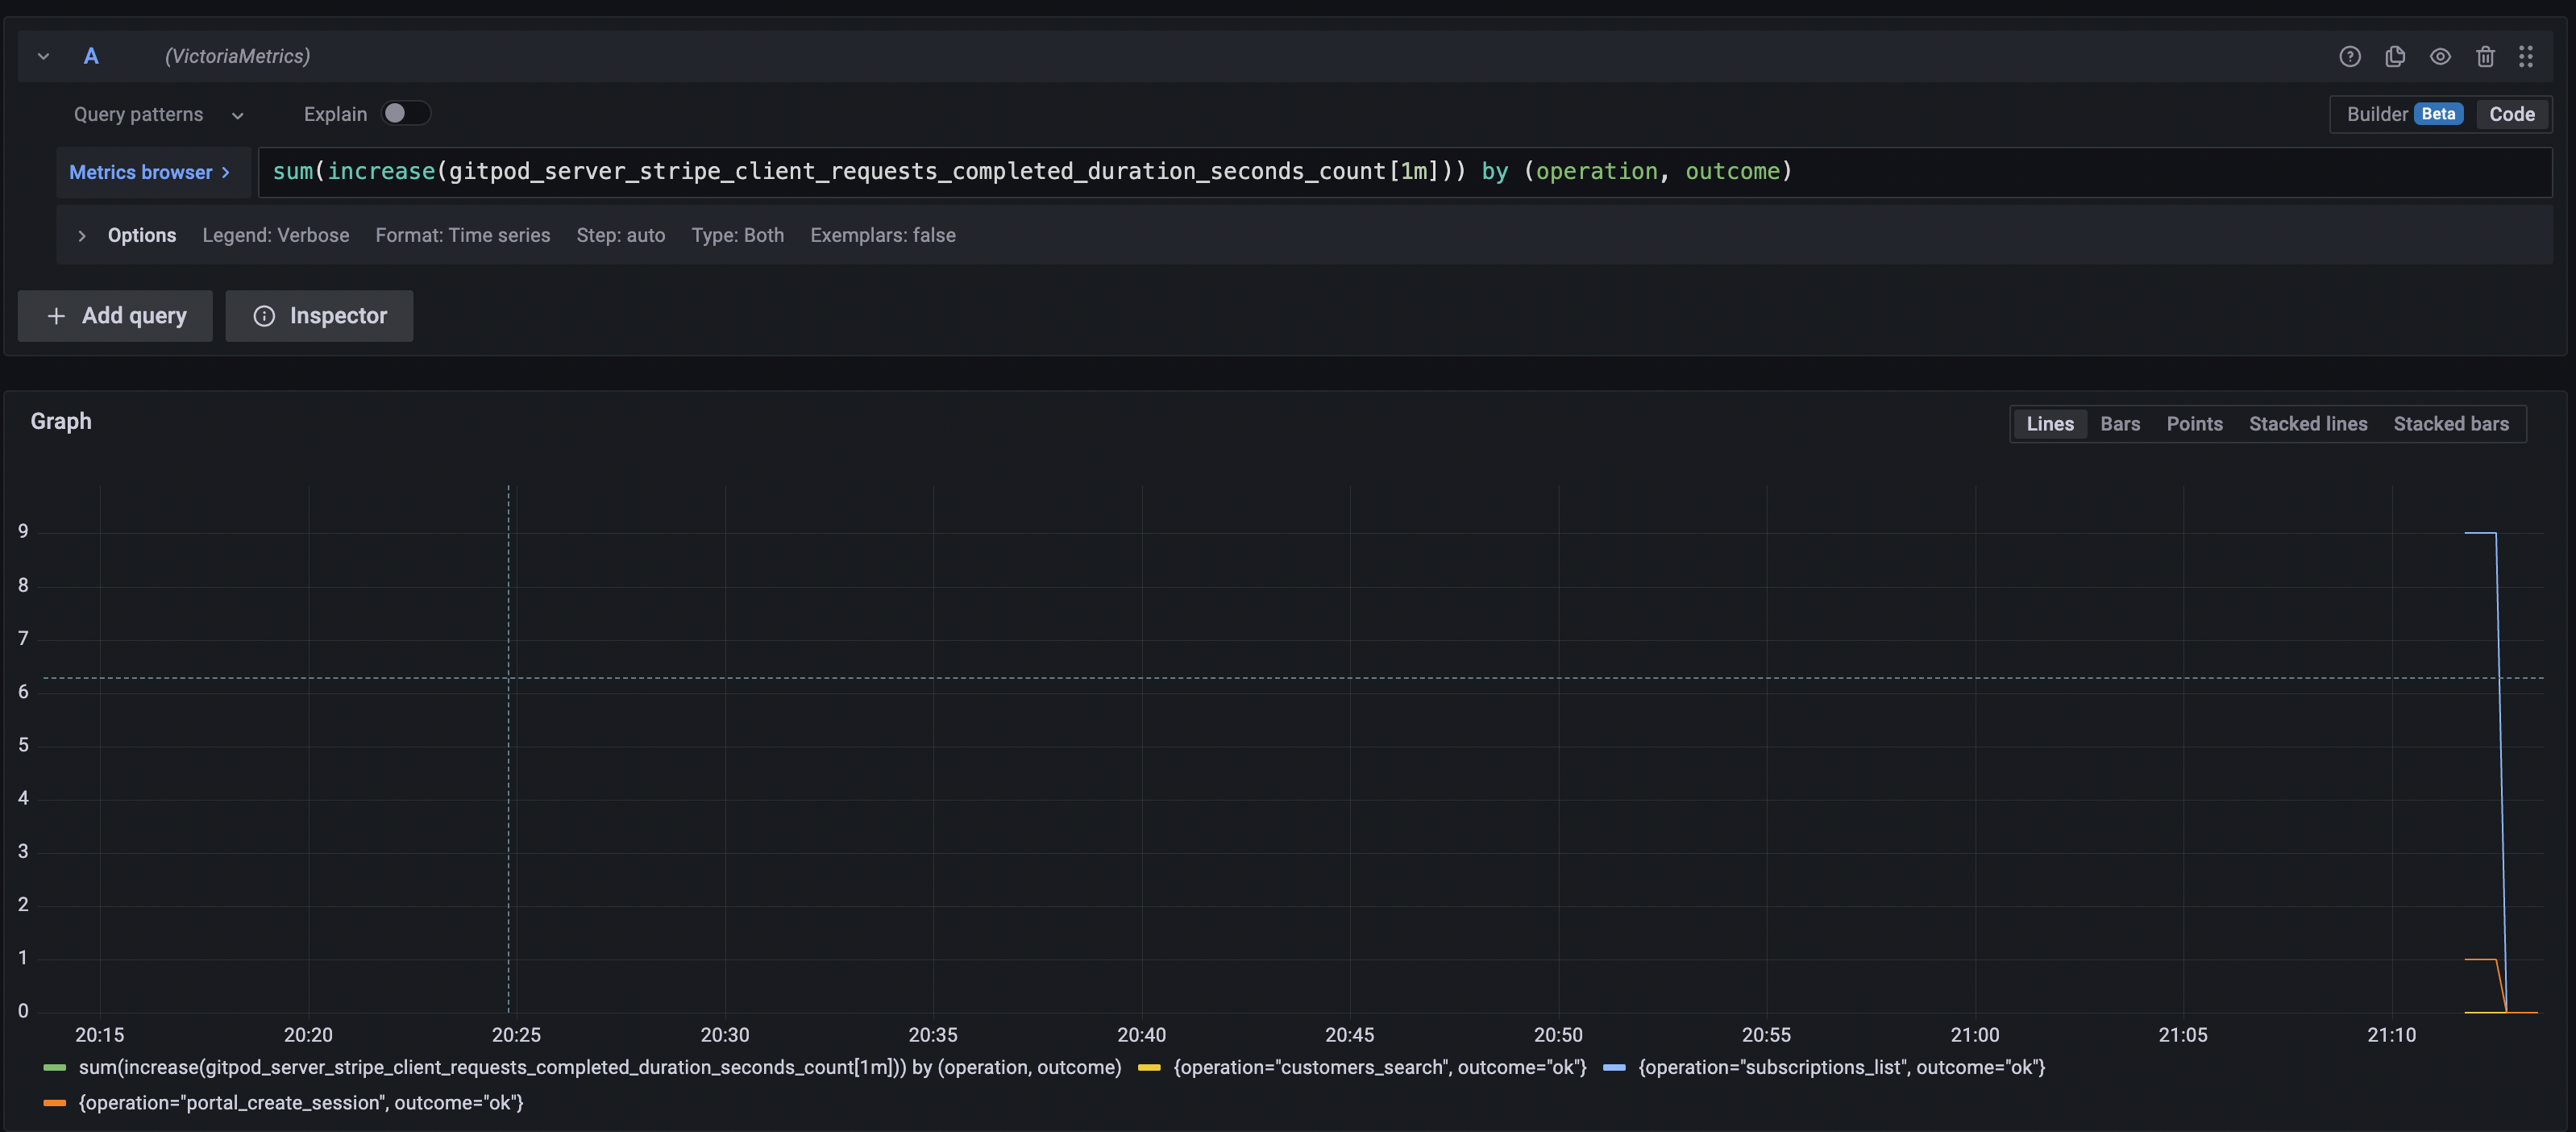
However, metrics from usage include the full path in their labels which also includes Subscription IDs - this would lead to high cardinality of these metrics and will need to be reworked. We'll need to strip the IDs and sub-resources.
Metrics reported from usage
Fix for the high cardinality metrics is here - https://github.com/gitpod-io/gitpod/pull/13701