sentry-rust
 sentry-rust copied to clipboard
Backtrace wrong when using tokio (windows)
Environment
How do you use Sentry? Sentry SaaS
Which SDK and version? 0.26.0
Steps to Reproduce
I'm capturing a panicking unwrap with sentry, but for some reason it doesn't show any of my own code in the backtrace (just tokio and some system code). I'm also using sentry-contrib-breakpad 0.4, not sure if that affects things. Also not sure if tokio is part of the problem here.
Expected Result
I would expect it to show me where in my own code the unwrap happened.
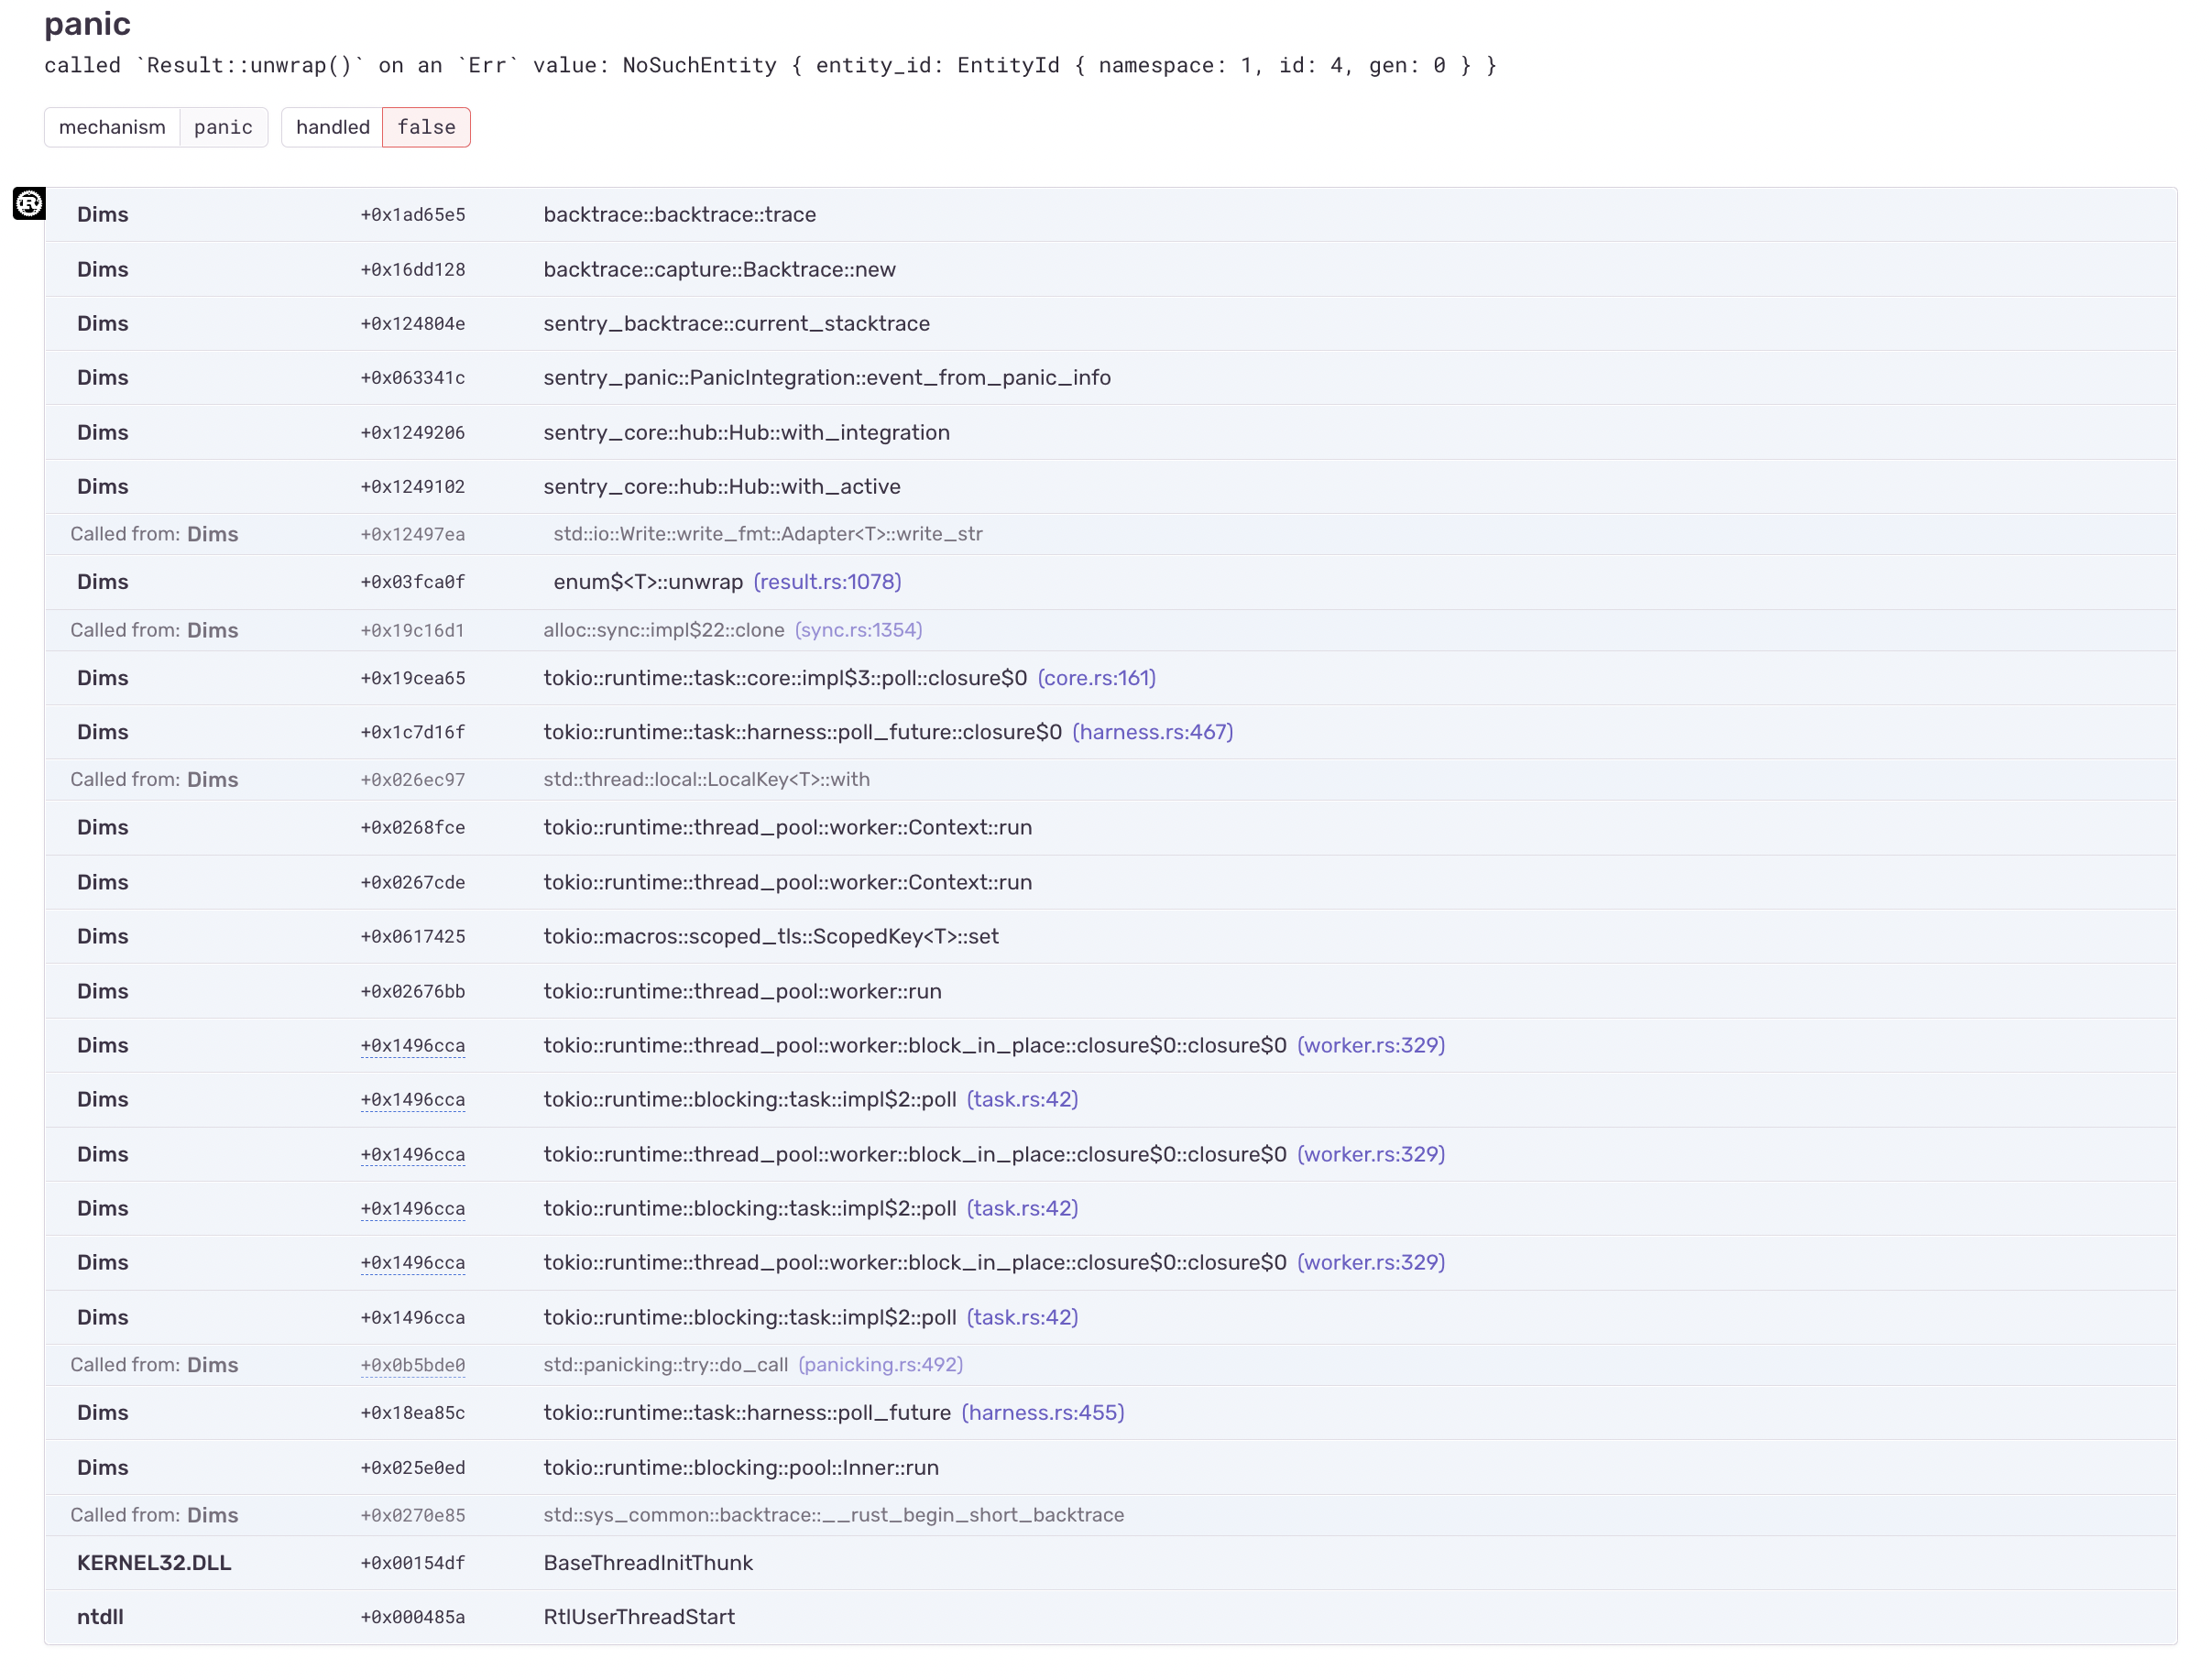
Actual Result
Here's a screenshot. None of the backtrace rows are in my code.
Sorry for the late answer. Can you expand the stack trace to show the full details? Maybe giving a link to the sentry Event is also a good idea in that case we can look at things directly.
I suspect that its just the "in-app" logic that hides a couple of stack frames.
@Swatinem Sorry for an even later answer, but I got something like this again. Here's a link to an error: https://sentry.io/share/issue/2df7c06320aa4e43ab221800c8973861/
Looking at this, it may as well just be the suboptimal async codegen in Rust.
  asset_processor     0x555eaa501252 core::result::unwrap_failed (result.rs:1785)
  asset_processor     0x555ea8c6e330 core::future::from_generator::GenFuture<T>::poll
There is an unwrap that happens in GenFuture, which is an implementation detail of Rust async.
Its a bit of Karma that I just landed an improvement to Rust itself that gets rid of these GenFuture wrappers: https://github.com/rust-lang/rust/pull/104321
You could try again with a recent nighty that avoids this wrapper, or try with RUSTFLAGS="-C symbol-mangling-version=v0" which puts a more detailed type name into that GenFuture.
I would be interested in the code that panics? Is it realistic that you are calling unwrap in the "root" async block that you spawned as a tokio task?
@Swatinem Oh that sounds amazing, I'll try upgrading to a newer nightly version.
Hm no I don't think it's an unwrap at the root.
This might have to do with not resolving inlined functions when symbolicating.
The actual async fn body was likely inlined into the outer GenFuture wrapper, and thus not visible in the stack trace in case inline functions were not resolved.
If you enable the debug-images feature (we will make this the default with the next release as well) and upload debug files to sentry, it should resolve inlined functions correctly.
Also, my work to remove GenFuture completely has landed in Rust 1.67, so there are other improvements there as well.
Please reopen if this is still a problem.
I'm encountering this as well once upgrading to sentry-rust 0.30.0 (i.e. once debug-images was enabled by default)
We previously ran release-mode binaries with debuginfo built in, so there was no need to upload symbols to Sentry — however with debug-images enabled, Sentry notes errors processing the events until I use the CLI to upload the binary though still has correct stack traces.
Once I do upload the binary to correct this issue, the stack traces become useless and are all tokio-related frames.
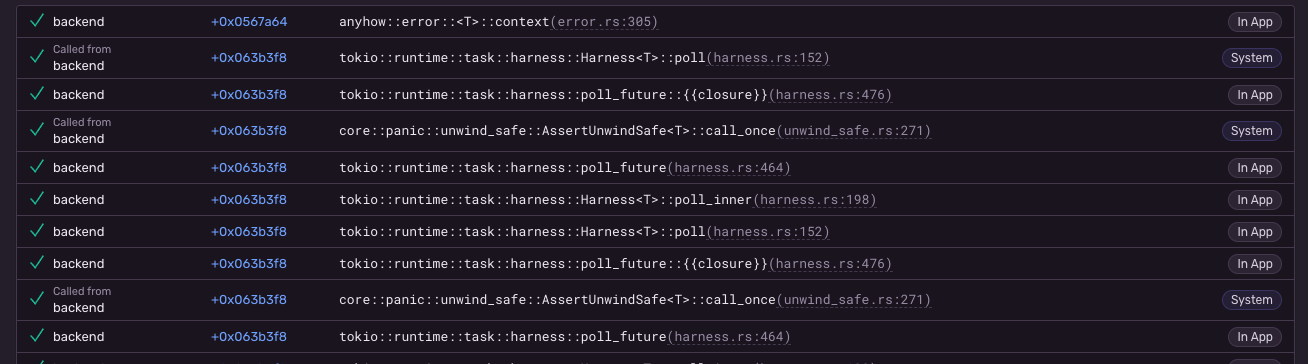
e.g. stack trace with debug-images enabled, no binary uploaded to sentry -- useful bactrace, with our first party code showing in the frames:
 stack trace with
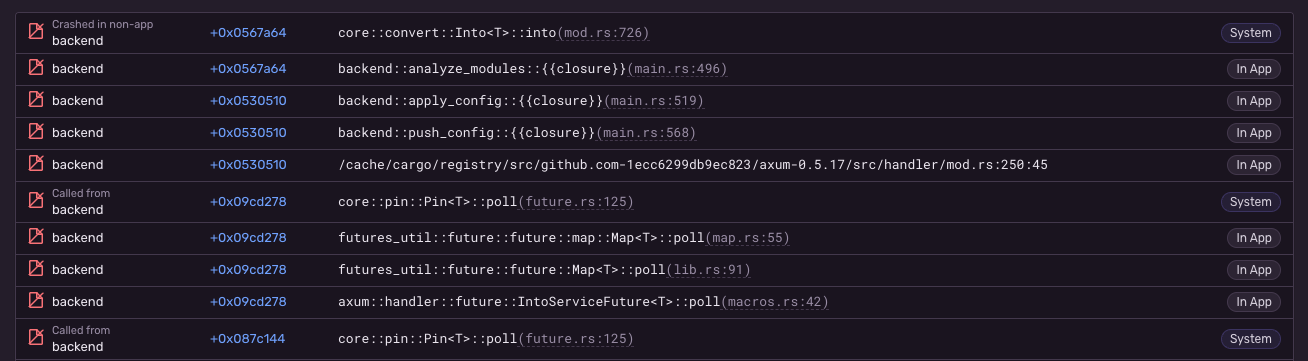
 debug-images enabled, binary uploaded to sentry -- not useful, all tokio frames:
 bonus, same stack trace above but with "unsymbolicated" chosen as the display option -- useful again!:
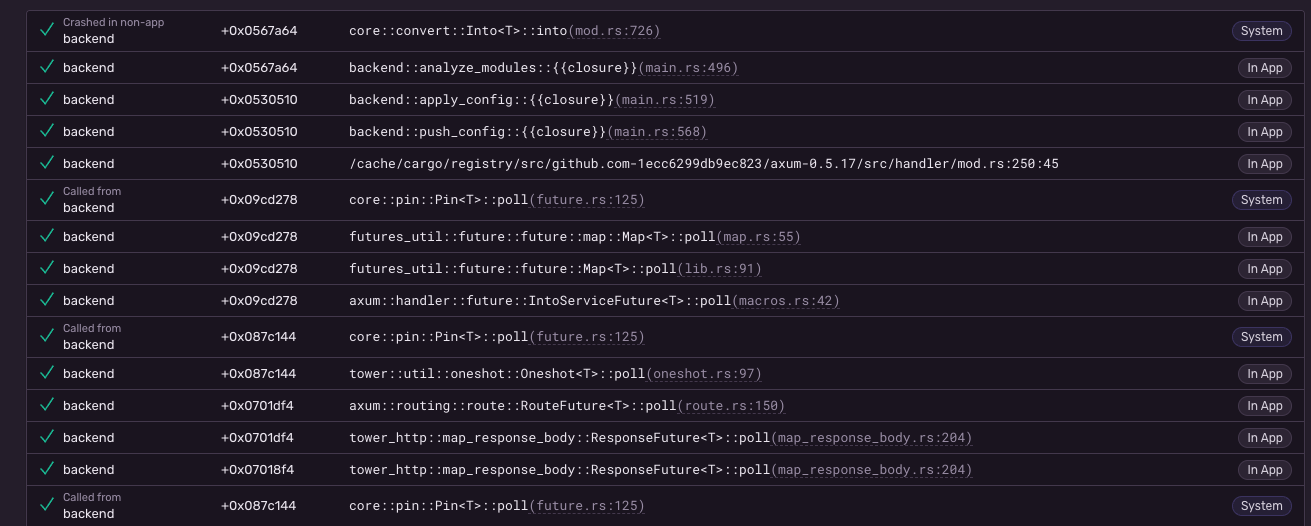
pretty odd that choosing "unsymbolicated" restores the frames we care about! as a short term fix I'll probably just disable debug-images again as our binaries already have debuginfo in them, but I'd love to be able to move back to server-side symbolication as our binaries grow larger
Hi @gautamg795 , thanks for the report.
This would seem like maybe some of the offsets reported by the debug-images integration could be wrong.
Can you provide a link to an event that has this problem?
Thanks for the quick response. This is on hosted Sentry for a private repo -- if you (as a Sentry employee) can access a private link I provide, happy to do so but I don't otherwise have a publicly shareable event I can link
Yes, as an employee I can look at the events as a matter of customer support :-)
If you do not want to share that publicly you can also mail it to me at [email protected]
Your case is very interesting, and I believe part of the problem is that you actually have debug info available at runtime…
If I look at your event from the bottom up (Sentry internally saves stack traces from your thread_start "upward"), things do symbolicate correctly.
For example, your entry point after libpthread looks like this:
<alloc::boxed::Box<F,A> as core::ops::function::FnOnce<Args>>::call_once (Rust)
  at /rustc/31f858d9a511f24fedb8ed997b28304fec809630/library/alloc/src/boxed.rs line 1988
<alloc::boxed::Box<F,A> as core::ops::function::FnOnce<Args>>::call_once (Rust)
  at /rustc/31f858d9a511f24fedb8ed997b28304fec809630/library/alloc/src/boxed.rs line 1988
std::sys::unix::thread::Thread::new::thread_start (Rust)
  at /rustc/31f858d9a511f24fedb8ed997b28304fec809630/library/std/src/sys/unix/thread.rs line 108
(NOTE that Sentry itself will just collapse the mutual recursion on line 1988)
However, as due to debug symbols available at runtime, the runtime stack trace will already resolve these inline functions. Which we will then do again on the server-side. This pretty much leads to exponential explosion as you will end up with 9 frames (3*3) for that one instruction addr.
This continues from the bottom upwards, the next frame expands to the following inlined frames:
core::ptr::non_null::NonNull<T>::as_ref (Rust)
  at /rustc/31f858d9a511f24fedb8ed997b28304fec809630/library/core/src/ptr/non_null.rs line 376
alloc::sync::Arc<T>::inner (Rust)
  at /rustc/31f858d9a511f24fedb8ed997b28304fec809630/library/alloc/src/sync.rs line 1260
<alloc::sync::Arc<T> as core::ops::deref::Deref>::deref (Rust)
  at /rustc/31f858d9a511f24fedb8ed997b28304fec809630/library/alloc/src/sync.rs line 1536
std::thread::Builder::spawn_unchecked_::{{closure}} (Rust)
  at /rustc/31f858d9a511f24fedb8ed997b28304fec809630/library/std/src/thread/mod.rs line 566
core::ops::function::FnOnce::call_once{{vtable.shim}} (Rust)
  at /rustc/31f858d9a511f24fedb8ed997b28304fec809630/library/core/src/ops/function.rs line 250
That ends up due to exponential explosion to 25 frames.
I believe at the end, this then runs into a hard limit we have somewhere (I haven’t found exactly where though) of ~250 stack frames per thread, where it just seems to cut off.
I would advise you to try stripping the debug-info from your binary and see if things are working fine with just server-side symbolication.
Indeed, there is a hard limit after event symbolication, which is applied here:
https://github.com/getsentry/relay/blob/4531dd835a5c5d684cb8f038ab820aa650a471aa/relay-general/src/store/trimming.rs#L249
I suspect that is indeed the problem: symbolication itself works correctly, but due to this explosion of inline frames, the stack trace is just truncated and therefore looks incorrect.
Thanks for the deep investigation! I haven't had a chance to try with a stripped build yet but it's on my list for next week and I'll get back to you with the results.
Just confirmed with a stripped build + uploaded symbols that backtraces work correctly / as expected — thanks for figuring this out!
It'll take some time for me to integrate symbol uploading into our build pipeline so I was going to just leave debug-images off for now and continue deploying builds with debuginfo — are there any downsides to continuing with this approach?
i.e. other than allowing for smaller binaries in production, any reason we should be moving towards stripped binaries + debug-images + uploaded symbols?
The only additional selling point would be that you can also upload and display source context on sentry :-)
Wow, I've been trying to get stack traces working for a few weeks now, to think that the option I thought essential turned out to be the culprit.
I removed debuginfo = true from my release profile and I now have understandable stack traces, thanks guys! 🎉
Btw the issue title says "(windows)" but the same problem also exists on macOS and Linux.