Sessions on a crashed app not closed as such
Package
Sentry
.NET Flavor
.NET
.NET Version
6.0.6
OS
macOS
SDK Version
3.20.1
Self-Hosted Sentry Version
No response
Steps to Reproduce
using Sentry;

using var _ = SentrySdk.Init(o =>
{
    o.Dsn = "https://[email protected]/6630214";
    o.Debug = true;
    o.TracesSampleRate = 1.0;
    o.IsGlobalModeEnabled = true;
    o.AutoSessionTracking = true;
#if DEBUG
    o.Environment = "development";
#endif
});

var tran = SentrySdk.StartTransaction("asd", "asd.asd");
// Forgot about this. Not a great API
SentrySdk.ConfigureScope(s => s.Transaction = tran);

try
{
        throw new Exception("Can't find summary line. Page changed?");
}
catch (Exception e)
{
 // Exception is only captured and tied to the transaction if I explicitly capture it here
    throw; // When I rethrow, the session ends as success (no session update it sent, only the initial healthy one)
}
If I remove the using var _ =, so the SDK doesn't dispose anymore and everything works as expected
Expected Result
Session marked as crashed The event that crashed the app captured. Event links to transaction The transaction marked as failed and links to the error
Actual Result
Only a transaction was captured and its status was unknown.
Additionally (but unrelated) the installationid is getting installed on (/Users/bruno/.local/share/Sentry/4F084E9C0D55B08D0AAF5DD0615DF4A719A28E29).. This seems to me it'll be shared with any other CLI executed via dotnet. I believe a child directory should be created named after the main assembly. Or any other solution that makes these ids different "per app".
  Debug: Logging enabled with ConsoleDiagnosticLogger and min level: Debug
  Debug: Initializing Hub for Dsn: '..'.
  Debug: Using 'GzipBufferedRequestBodyHandler' body compression strategy with level Optimal.
  Debug: Starting BackgroundWorker.
  Debug: Registering integration: 'AutoSessionTrackingIntegration'.
  Debug: Attempting to recover persisted session from file.
  Debug: Persistence directory is not set, returning.
  Debug: BackgroundWorker Started.
  Debug: Created directory for installation ID file (/Users/bruno/.local/share/Sentry/4F084E9C0D55B08D0AAF5DD0615DF4A719A28E29).
  Debug: Resolved installation ID '7053cbc5-a5eb-481c-8a88-dc5df456df92'.
   Info: Started new session (SID: b7cc11af66a742df8e3019e40eed5bf7; DID: 7053cbc5-a5eb-481c-8a88-dc5df456df92).
  Debug: Persisting session (SID: 'b7cc11af66a742df8e3019e40eed5bf7') to a file.
  Debug: Persistence directory is not set, returning.
  Debug: Enqueuing envelope
   Info: Envelope queued up: ''
  Debug: Registering integration: 'AppDomainUnhandledExceptionIntegration'.
  Debug: Registering integration: 'AppDomainProcessExitIntegration'.
  Debug: Registering integration: 'TaskUnobservedTaskExceptionIntegration'.
  Debug: Registering integration: 'SentryDiagnosticListenerIntegration'.
  Debug: Configuring the scope.
  Debug: Envelope  handed off to transport. #1 in queue.
  Debug: Envelope '' sent successfully. Payload: {"sdk":{"name":"sentry.dotnet","version":"3.20.1"},"sent_at":"2022-08-07T17:42:39.187397+00:00"} {"type":"session","length":297} {"sid":"b7cc11af66a742df8e3019e40eed5bf7","did":"7053cbc5-a5eb-481c-8a88-dc5df456df92","init":true,"started":"2022-08-07T13:42:38.846525-04:00","timestamp":"2022-08-07T17:42:38.847454+00:00","seq":0,"duration":0,"errors":0,"attrs":{"release":"[email protected]","environment":"development"}}
  Debug: De-queueing event
  Debug: Configuring the scope.
  Debug: Enqueuing envelope 22a5b79cf4cf4076b55ef16fa7cd8f56
   Info: Envelope queued up: '22a5b79cf4cf4076b55ef16fa7cd8f56'
   Info: Disposing the Hub.
  Debug: Tracking depth: 1.
  Debug: Envelope 22a5b79cf4cf4076b55ef16fa7cd8f56 handed off to transport. #1 in queue.
  Debug: Envelope '22a5b79cf4cf4076b55ef16fa7cd8f56' sent successfully. Payload: {"sdk":{"name":"sentry.dotnet","version":"3.20.1"},"event_id":"22a5b79cf4cf4076b55ef16fa7cd8f56","sent_at":"2022-08-07T17:42:39.34872+00:00"} {"type":"transaction","length":988} {"type":"transaction","event_id":"22a5b79cf4cf4076b55ef16fa7cd8f56","platform":"csharp","release":"[email protected]","transaction":"crawl","start_timestamp":"2022-08-07T17:42:38.85351+00:00","timestamp":"2022-08-07T17:42:39.2768096+00:00","request":{},"contexts":{"trace":{"type":"trace","span_id":"e2f261a76bed46e6","trace_id":"2c8a687cbe7a4d538eef188a2ea2143b","op":"asd","status":"unknown_error"},"runtime":{"type":"runtime","name":".NET","version":"6.0.6","raw_description":".NET 6.0.6","identifier":"osx.12-x64"},"device":{"type":"device","boot_time":"2022-08-06T09:07:50.5696732+00:00"},"app":{"type":"app","app_start_time":"2022-08-07T17:42:38.381471+00:00"},"os":{"type":"os","raw_description":"Darwin 21.5.0 Darwin Kernel Version 21.5.0: Tue Apr 26 21:08:22 PDT 2022; root:xnu-8020.121.3~4/RELEASE_X86_64"}},"user":{},"environment":"development","sdk":{"packages":[{"name":"nuget:sentry.dotnet","version":"3.20.1"}],"name":"sentry.dotnet","version":"3.20.1"}}
  Debug: De-queueing event 22a5b79cf4cf4076b55ef16fa7cd8f56
  Debug: Signaling flush completed.
  Debug: Successfully flushed all events up to call to FlushAsync.
   Info: AppDomain process exited: Disposing SDK.
   Info: Disposing the Hub.
Is this because we are in top-level code with no Main? Perhaps it's async under the hood, in which it would be similar to
https://docs.sentry.io/platforms/dotnet/troubleshooting/#unhandled-exceptions-are-not-captured-when-using-an-async-main-method
so the main is not async OOTB
private static void <Main>$(string[] args)
{
	SentrySdk.Init(delegate(SentryOptions o)
	{
		o.Dsn = "https://[email protected]/5994502";
		o.Debug = true;
		o.TracesSampleRate = 1.0;
		o.IsGlobalModeEnabled = true;
		o.AutoSessionTracking = true;
		o.Environment = "development";
	});
	ITransaction tran = SentrySdk.StartTransaction("asd", "asd.asd");
	SentrySdk.ConfigureScope(delegate(Scope s)
	{
		s.Transaction = tran;
	});
	try
	{
		throw new Exception("Can't find summary line. Page changed?");
	}
	catch (Exception)
	{
		throw;
	}
}
The transaction marked as failed and links to the error
Only a transaction was captured and its status was unknown.
where do i see this information in the sentry UI?
so the main is not async OOTB
What I meant was, that being in top-level code (no main) is it the same as being in an async main? I've answered by own question on that though. The way it's working under the hood is that if you have any await in the top-level code, then it gets wrapped in an async main. Otherwise it gets wrapped in a non-async main.
Since Bruno's sample doesn't have any await - then I think it's not due to being in top-level code. Sorry for the red-herring.
The transaction marked as failed and links to the error
Only a transaction was captured and its status was unknown.
where do i see this information in the sentry UI?
Go to Performance, then pick the project, then click All Transactions find the transaction and click on it, then find related issues linked at the bottom.
One gotcha that can make it hard to find transactions - select the project first. Otherwise you're on the wrong tab and won't see them. (I wrote that UX bug up here: https://github.com/getsentry/sentry/issues/38435)
@bruno-garcia - I think Simon and I are both confused just about where specifically to look for the problem in the Sentry UI. Where do we see the expected "Session marked as crashed"? A screenshot would be super helpful. Thanks.
I've elaborated the description further. If this wasn't clear: It's about Sessions and Transactions and the basic support of reporting sessinos as crashed when the process crashed, that seem broken. Additionally the transaction should be marked as errored (with some failure code, e.g: 500).
I believe this is p1 or even p0 since for CLI's at least, we're definitely reporting the wrong Crash Free rate
Only a transaction was captured and its status was unknown.
where do i see this information in the sentry UI?
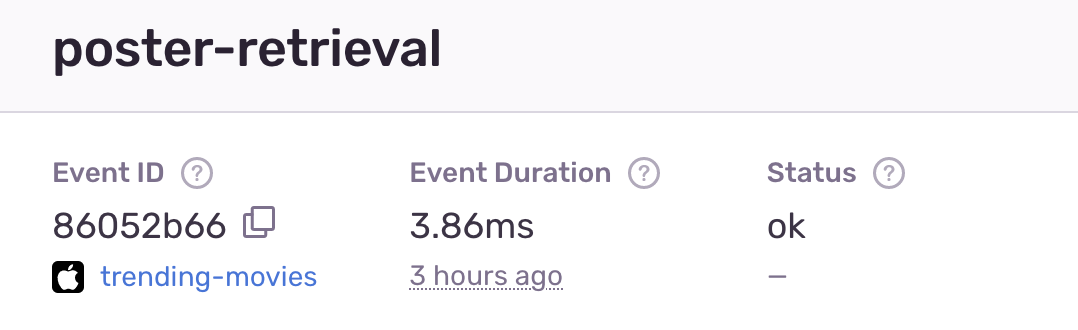
In the Transaction view in Sentry:
Where do we see the expected "Session marked as crashed"?
Sessions are the envelope items that power the release health product. We calculate Crash Free Rate based on those envelopes.
If youb app is crashing, you don't expect to see 100% crash free rate
ok i found where to see this in the UI
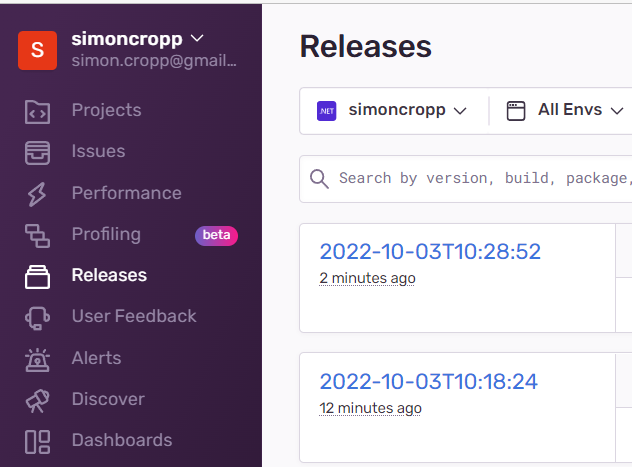
under releases. then click on the specific release
i change my sample to use a timestamp as a release. so i could see them in isolation https://github.com/getsentry/sentry-dotnet/pull/1925/commits/425a3ab7e5828eebfa86bcd798423b3f4dce7694
but i am still having trouble repro'ing.
and it works multiple times
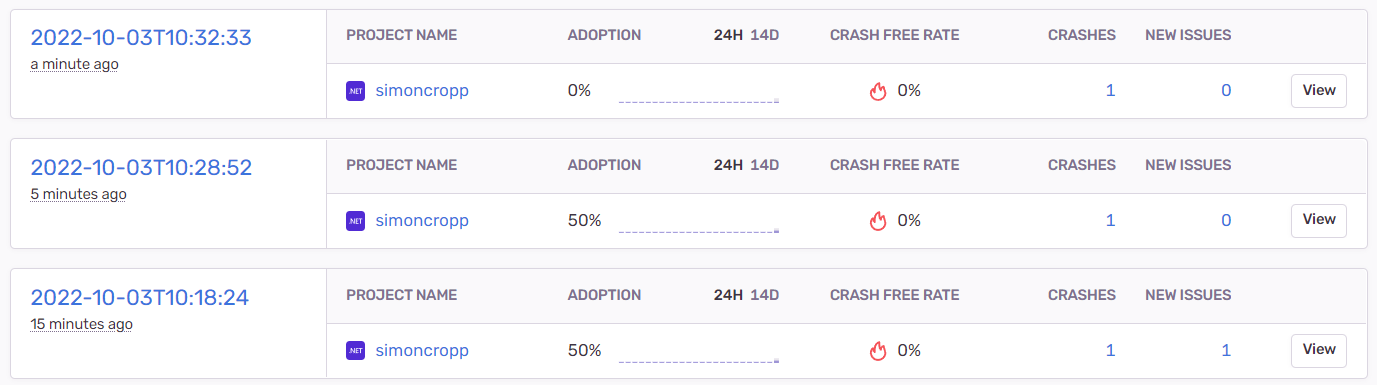
side note: the crash free rate took a few min to catch up after the crash was registered in the UI
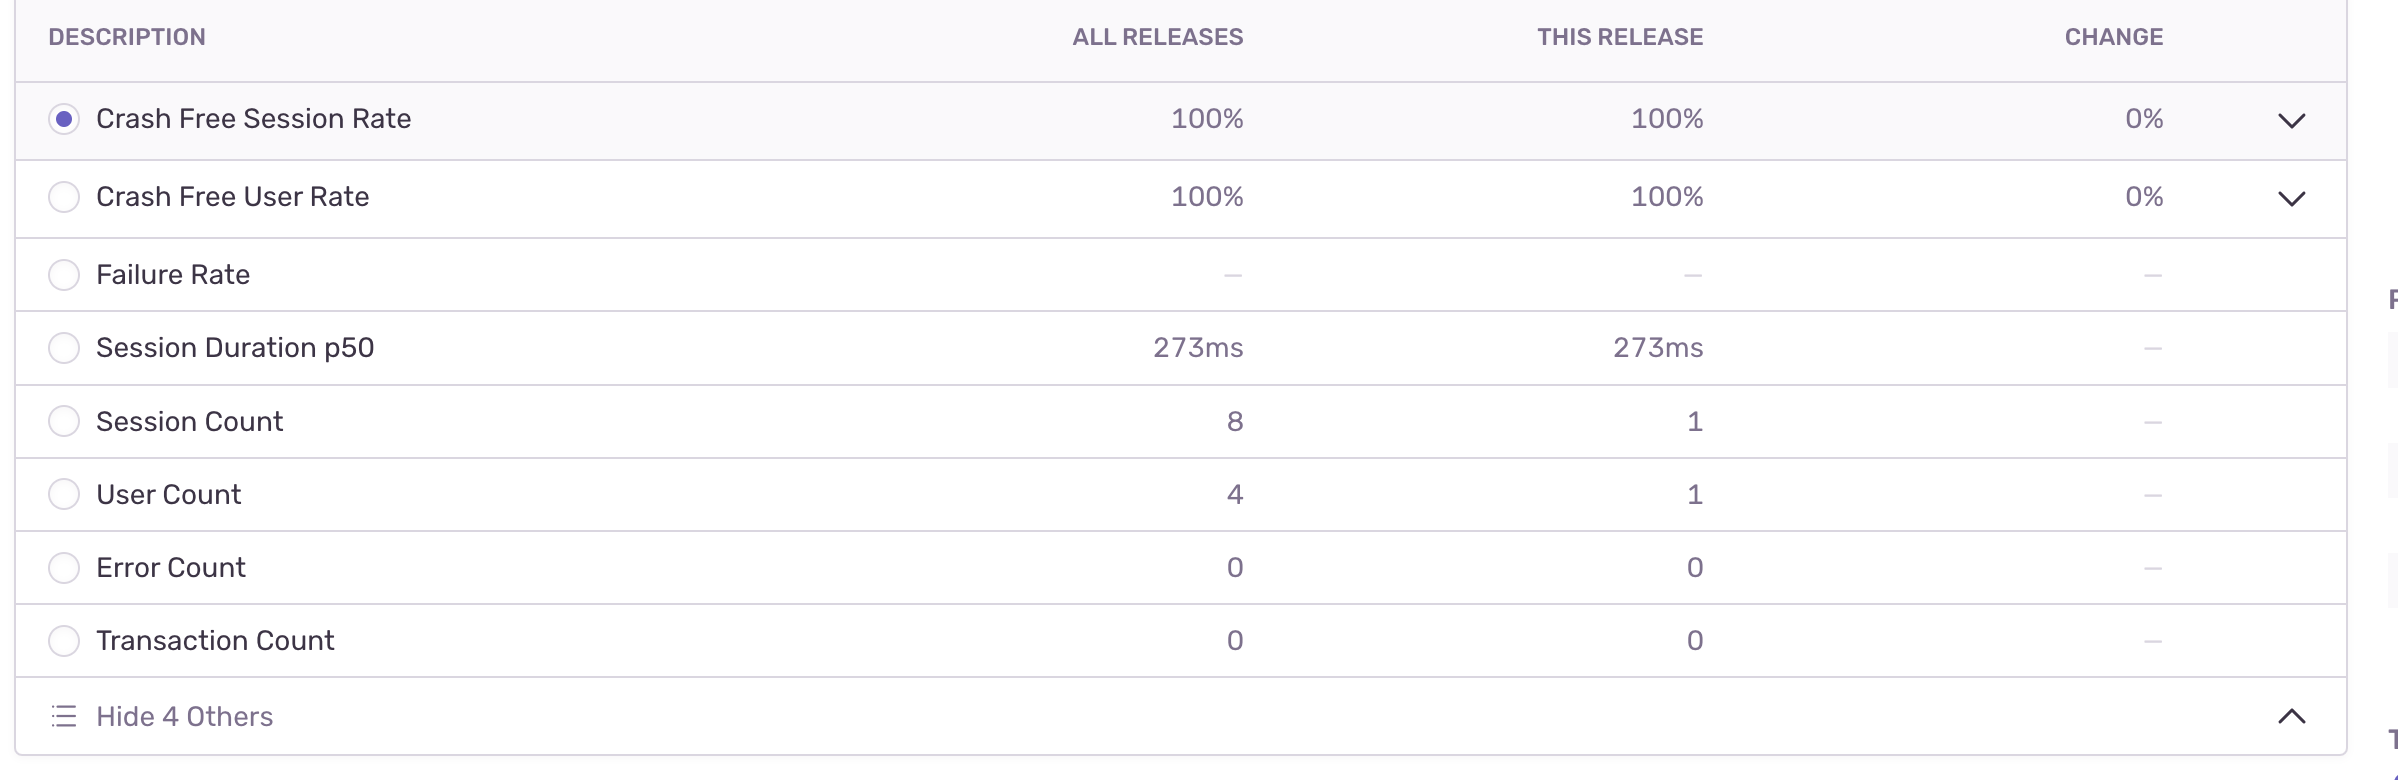
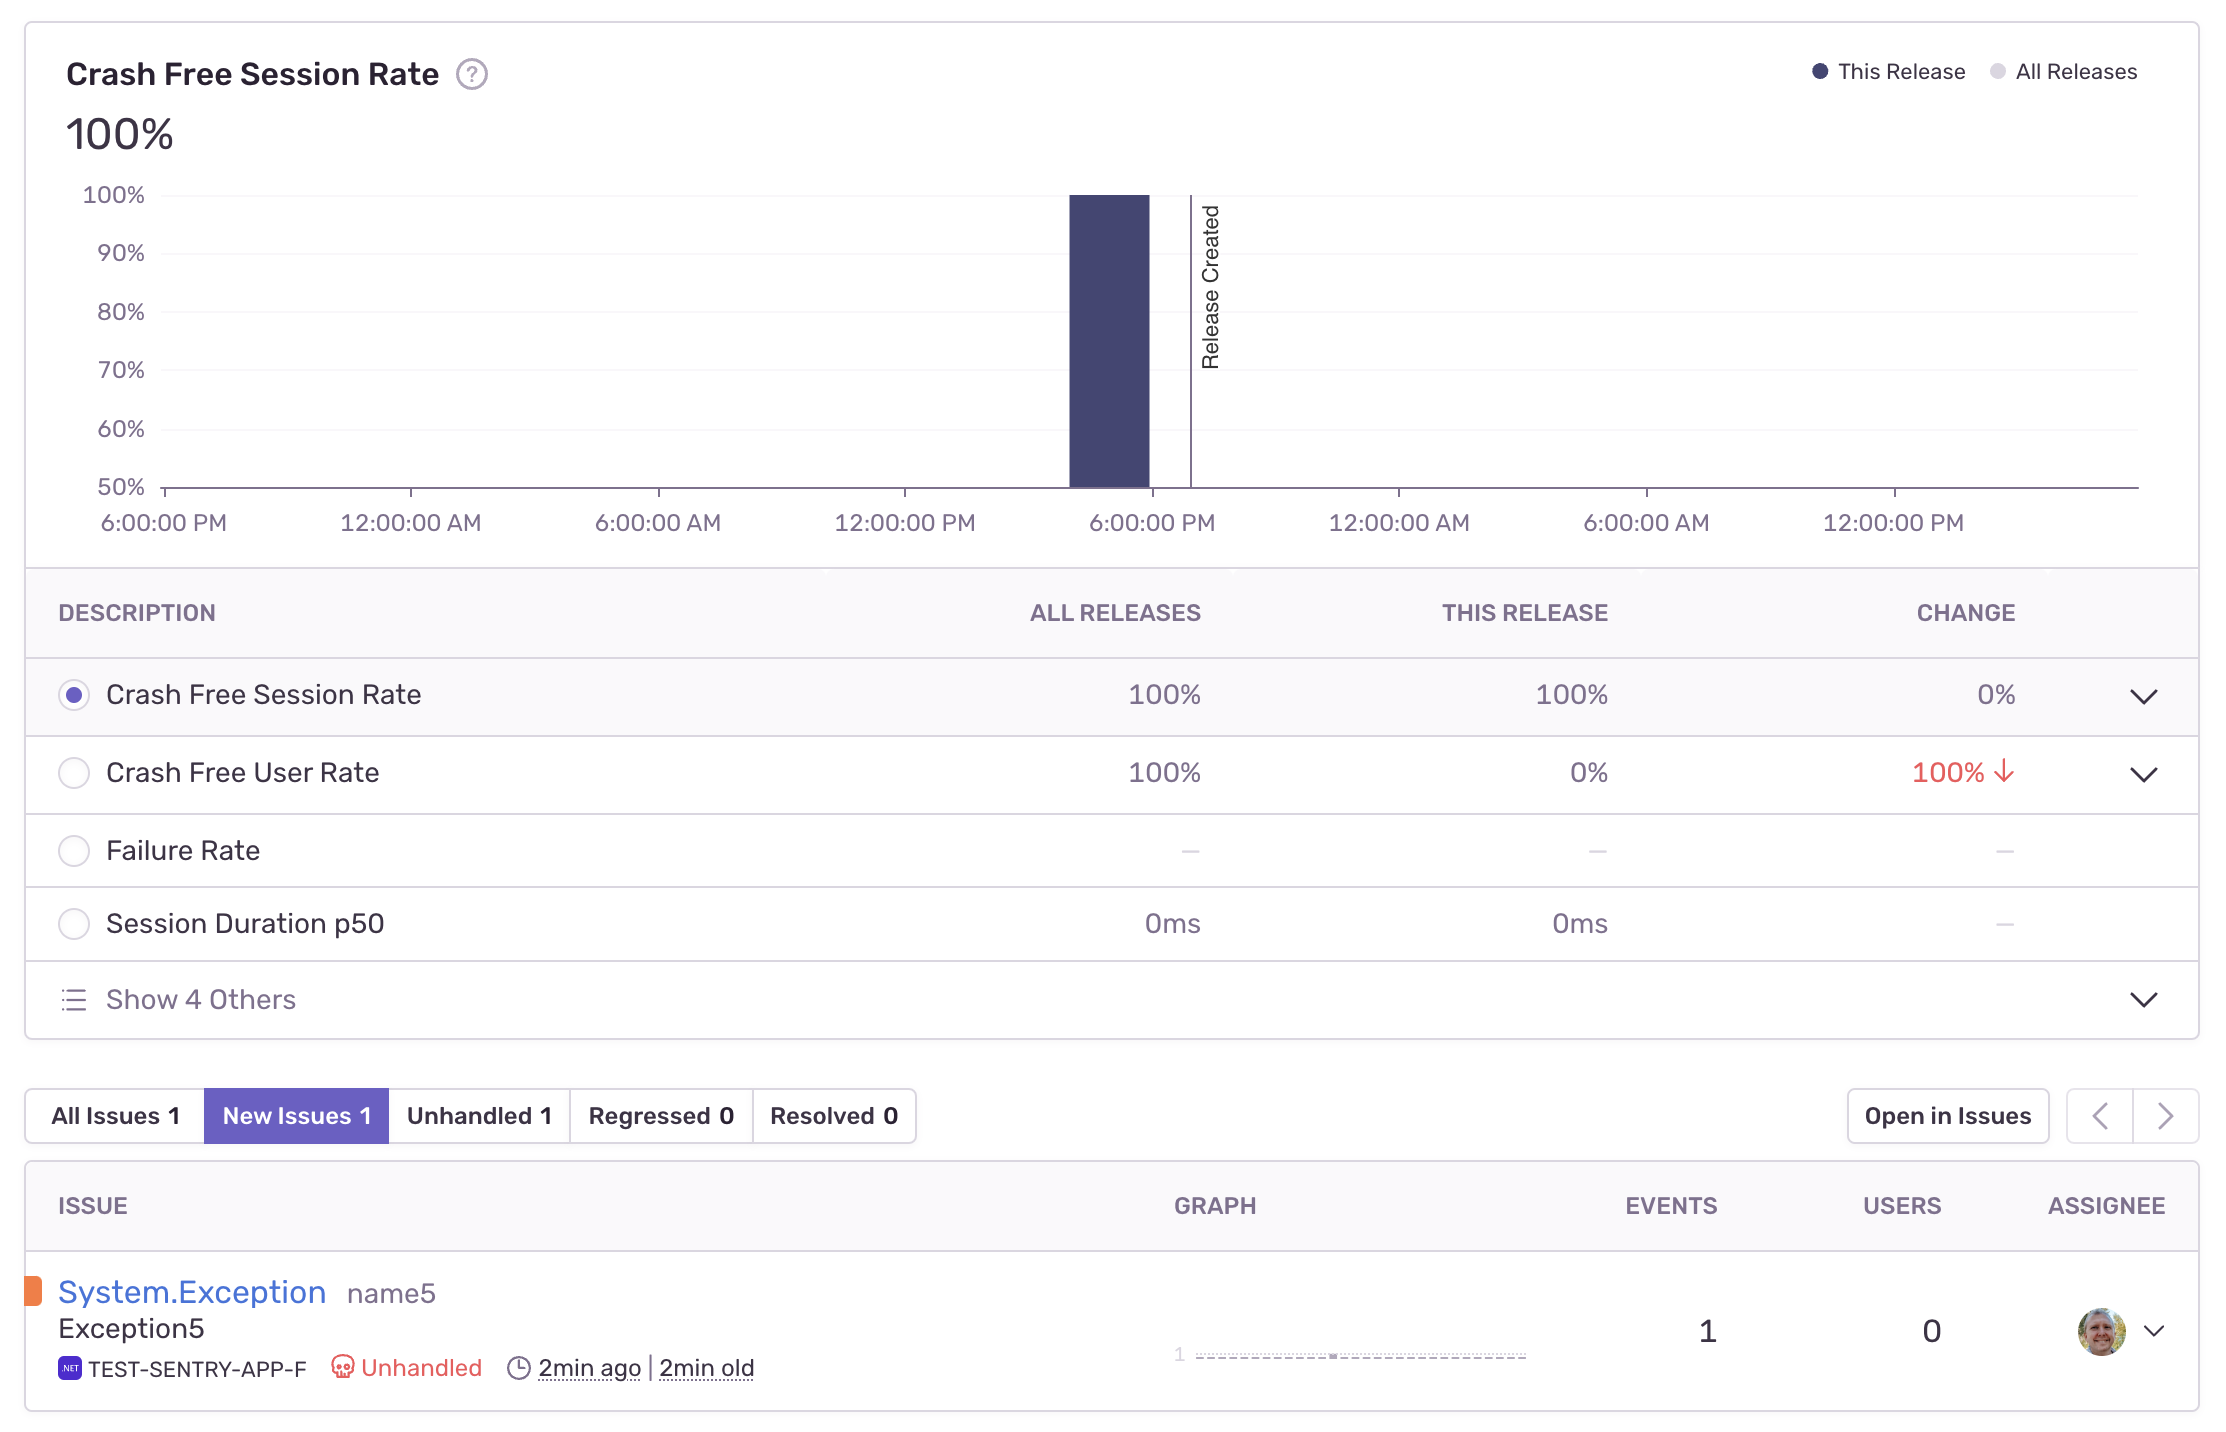
I was able to get a crashed session that shows a release with 100% crash free session rate:
From the payload emitted during debug (whitespace added):
{"type": "session", "length": 313}
{
    "sid": "b132dbb365ba4952b290dc63c207688f",
    "did": "4e01e65c-8951-4610-ac6b-7805e72269d9",
    "init": false,
    "started": "2022-10-05T17:56:49.927511-07:00",
    "timestamp": "2022-10-06T00:56:49.940636+00:00",
    "seq": 1,
    "duration": 0,
    "errors": 0,
    "status": "crashed",
    "attrs": {
        "release": "2022-10-05T05:56:49",
        "environment": "development"
    }
}
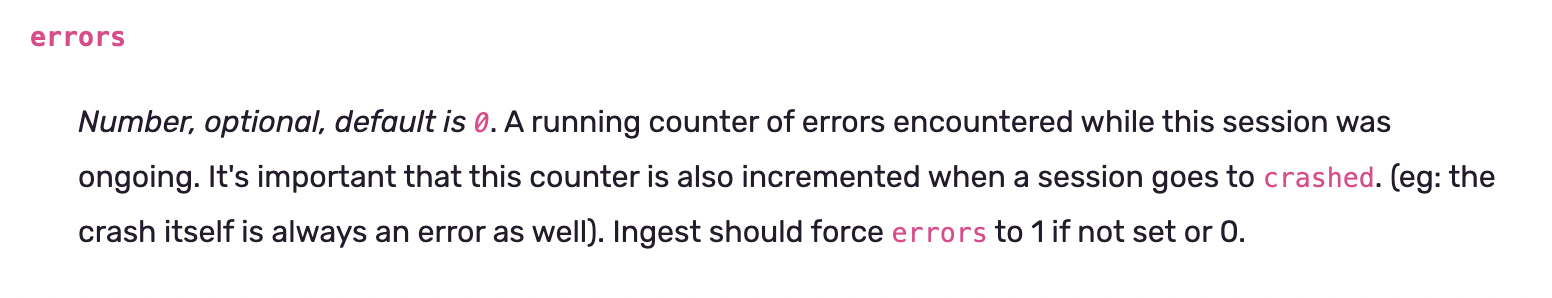
We show the status as crashed, but we errors still says 0.
Per https://develop.sentry.dev/sdk/sessions/#session-update-payload, we need to keep that updated.
Update: the errors count part is fixed in #1972. Also, I only ever saw the 100% crash free the once. After a a few minutes it updated to 0% on its own and I never could repro again.
Something else is going on here, perhaps on the back end.
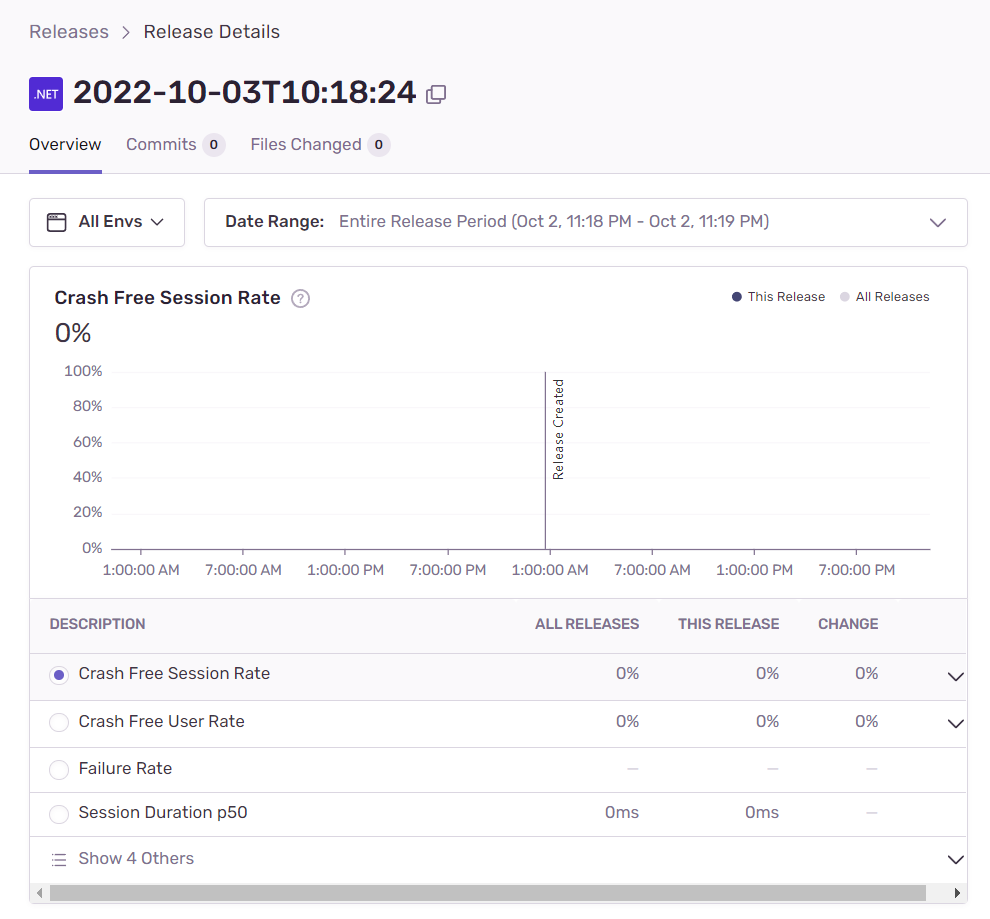
I tried again without any changes and this time I get 0%. Well, first it shows up blank and then a few minutes later it fills in with 0%.
It doesn't seem to matter if I set errors to 1 or not - I think that's because of the last part that says "Ingest should force errors to 1 if not set or 0`.
Doing some more testing, it would seem some of this is related to latency with updating the stats on the back end. Let it sit a minute or so, refresh, and the data is as expected. At least for the crash free rates, etc.
In all attempts, I am seeing the session update payload being sent in the debug output. Example a few comments up. So far, I never get the results seen in the logs @bruno-garcia showed at the top of this issue.
I've tried reproing with 3.20.1 and also with older versions and other various options set. I did see that if caching is enabled, no envelopes are sent at all under 3.20.1 (because the app shuts down too fast) - but it works fine under 3.21.0 because of the fix in #1890.
One interesting thing I just noticed with the logs at the top of the issue. They show a session start, and then a transaction, but never an event or session update.
In my testing, I get the session start, then an event, followed by the session update. The event has "type": "event" - not "type": "tranasction". The "transaction" name is filled out though.
I've only seen a "type": "transaction" envelope item come through if I explicitly call tran.Finish().
@bruno-garcia - Should an envelope item with "type": "transaction" still be sent if an error event is crashing the app?
From: https://docs.sentry.io/product/sentry-basics/tracing/trace-view/#troubleshooting
... In addition, broken subtraces can occur when Sentry receives an error for a trace, but the corresponding transaction does not exist. In this case, the error will not appear on the trace view and the trace navigator won't appear on the Issue Details page. ...
Not sure if that explains the whole thing, but it does at least confirm that it's possible for Sentry to receive an error without receiving the corresponding transaction. That does seem to be what is happening when I try to recreate this.
I still don't understand how the transaction event is in the error logs originally reported on the top of this issue, since the transaction was never finished.
Since we can't reproduce the issue (I always get a crashed session update), I'll close this for now.
Continuing the discussion about unfinished transactions in #1975.