Order of x-axis bar charts changes on a "Group By". Maintain order.
Sometimes we would like the order of the x-axis bars to not be in alphabetical order, and we will like this to remain in the same order as the table, when we do a 'group by'.
To reproduce:
- Sort the data from the query. Note the table produced is in the right order.
- Create a visualization. Note the x-axis bars are arranged in the same order as the table.
- Select 'Group By' after enabling Stacking. The ordering of the x-axis bars change.
- The order changes again based on the z-index values of the y-axis.
I tried reproducing it here: http://demo.redash.io/queries/2255/source#3011 and couldn't. Note that I unchecked "Sort Values" option in the X Axis options.
Can you create an example that reproduces this on the demo instance?
So in your example, you didnt enable Stacking, but you can still see the bug we are talking about here. On execute of http://demo.redash.io/queries/2255/source#3011, the order of results is
- pivot
- login
- execute_query
- ...
but on the visualization of http://demo.redash.io/queries/2255/source#3011, the order of the x axis is
- pivot
- api_get
- update_data
- ...
when you enable stacking, like i did in http://demo.redash.io/queries/2256/source#3013 with the same query, the ordering changes again...for eg. the order of "login" on the x-axis changes.
Thanks.
I looked into the implementation and when we enable stacking, we delegate to Plotly to handle the logic behind grouping values and looks like it behaves unlike what you expect.
I did notice that if we "predefine" the order of the X axis, we can enforce a specific order - this is what happens when we enable X axis sorting. But in this case, you want "preserve order" sorting or maybe Y axis based sorting (because there are multiple groups, sorting based on count of a single row might not give you the result you want).
We also noticed that the legend is also not in order, especially for the area graph. Do you think they could be part of the same problem? I recreated that in here http://demo.redash.io/queries/2256/source#3410
Hey Arik..I meant in order as in I would like that since the x-axis has add_data_source, add_member, api_get,...then the legend be the same instead of query, redash, data_source.... But this is not an issue anymore. We understand how the order of the legend is formed and how to manipulate it to get what we want.
The other issue though that initially started this thread still remains an issue (x-axis order in table not maintained in chart). It is not of priority to us anymore as we've changed our visualizations, and you may close this issue if you want. But we are happy to answer any questions you may have about this issue if you want to look at it further.
I can reproduce the same problem that @amasare mentioned. Our temporary fix is to duplicate the column used in the group by so we are able to select it as the datapoint for the x axis too.
I just tried coloring bars differently based on whether they are representing positive or negative values. I added an extra column to the query returning me the sign of the number (i.e. "+" or "-"). When I group based on this column, I can get the coloring working. However, as this issue states, this breaks the ordering of the values. For some reason the bar chart expects groups of values to come in a sequence.
Note that other than in the other comments, I do not use stacking at all. So this might be a different issue.
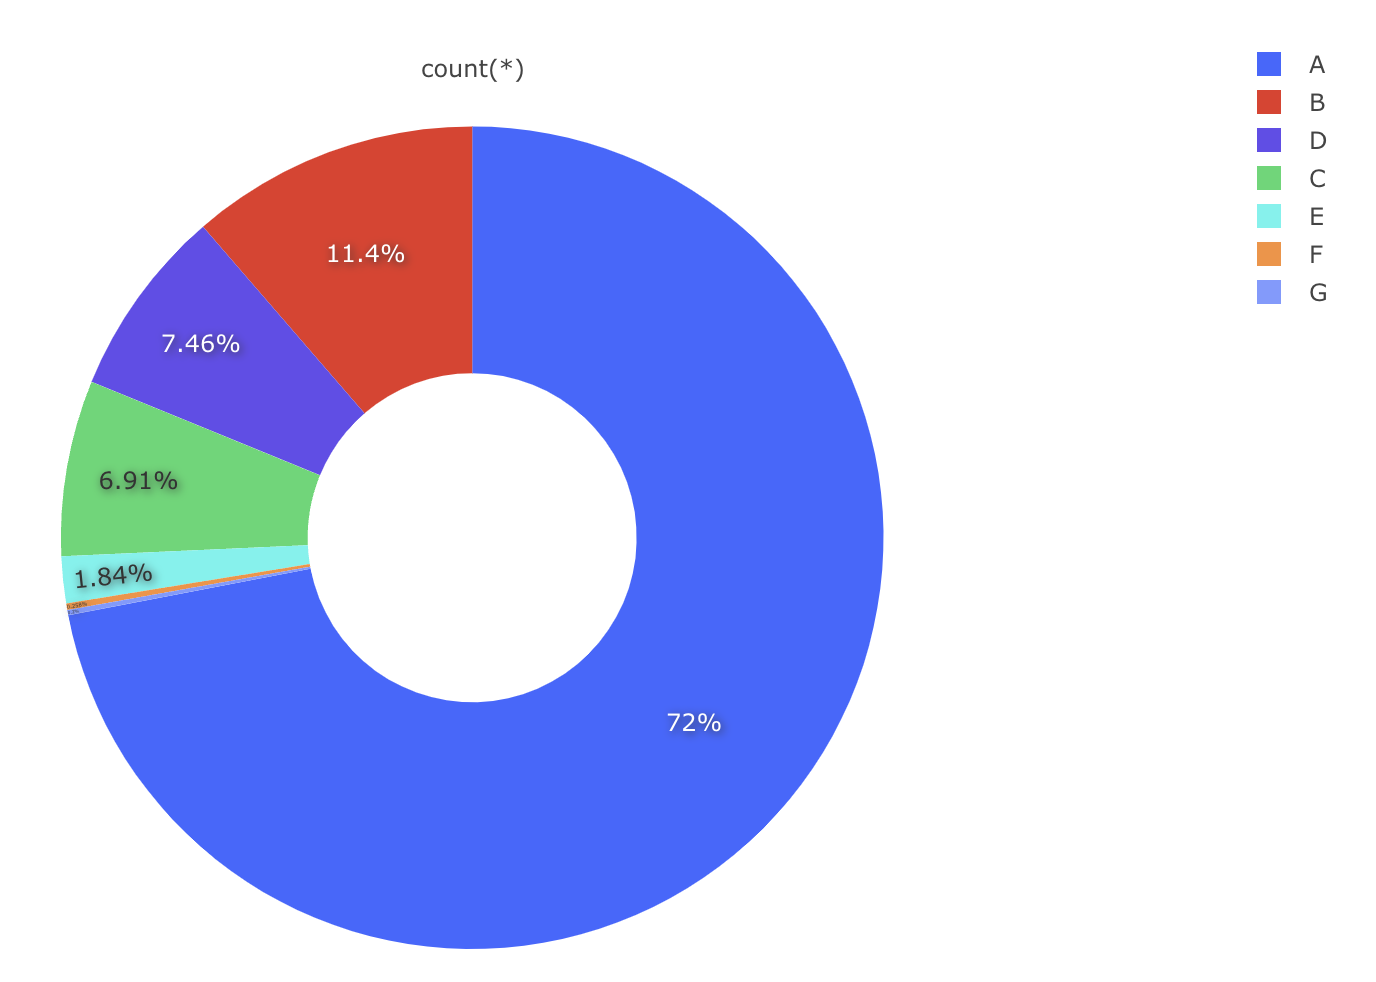
I know this issue is a few years old, but I am seeing the Pie Chart legend is out of order:
Still having this issue today. Any workaround? Ive got a bar for each day of the week, and I am using TO_CHAR to format the timestamp as just the name of the day of the week. When I group by and add a stack it sorts in the order: Mon, Wed, Thu, Fri, Sun, Tue, Sat. In my query I have ORDER BY date_trunc('day', m.timestamp)
Hi! I'm seeing this issue with unsorted legend items after applying "Group By" in the latest Redash version.