mtop
 mtop copied to clipboard
BitBar plugin to display CPU usage graph in the Mac OS X menu bar
mtop
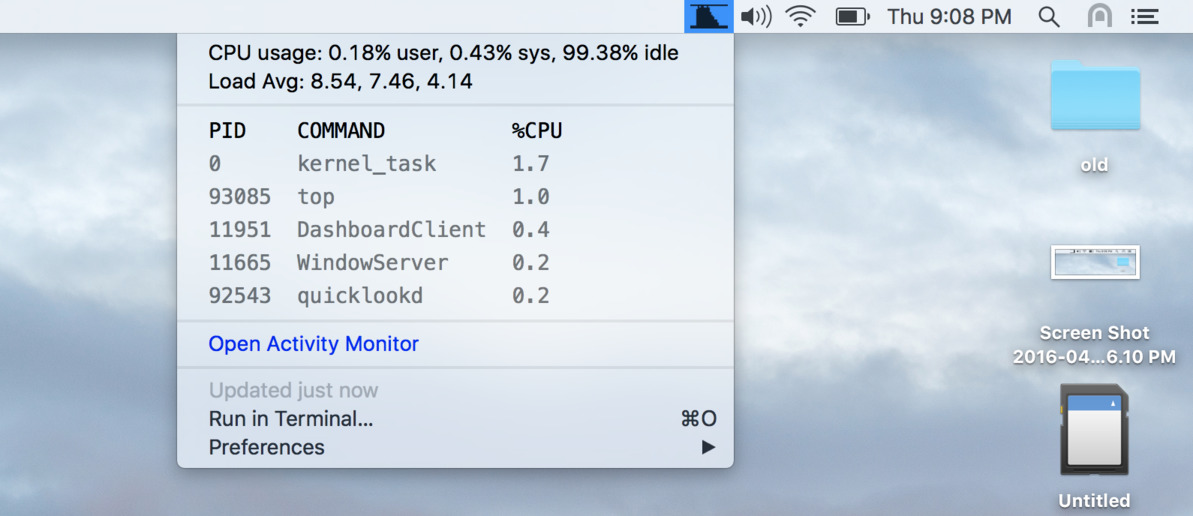
mtop is a BitBar plugin to display a graph of CPU
usage in the Mac OS X menu bar. Clicking the graph opens a dropdown containing
the current CPU usage (user, sys, idle), load average and the top 5 CPU hogs
as reported by top.
This bash script gets data from top and renders the usage graph to a BMP
file created from scratch, with no external image processing utilities or
dependencies.
mdf
mdf displays a rectangular icon on the Mac OS X menu bar which is filled in
proportion to disk space used on the primary disk. Clicking the icon opens
a dropdown containing details of disk space utilization for each physical
disk.

This bash script gets data from df -H and diskutil info and renders it
to a BMP file as above.
Usage
Install BitBar and copy mtop.5s.sh, mdf.1m.sh
from this repo into the plugins directory you chose when you first ran BitBar.
That's it. You should see the mtop and mdf icons in your menu bar.
Should work on Mountain Lion through El Capitan.
Build
make clean
make
A plugin script should ideally be a single self-contained file which can be dropped into the BitBar plugins directory.
Plugin sources are kept in src. Libraries and files included using . or
source are expanded inline during make. This keeps the plugin source
clean, while the "compiled" plugin in the base directory is a single
self-contained file.