Visual representation of influence diagrams and programmatic generation using Mermaid.js
The visual representation of influence diagrams requires visualizing nodes, information sets, and states. Nodes should have distinct shapes and colors. We should represent them in depth-wise order from left to right. For example:
- Chance nodes: Circle, light-blue, stroke-width 3
- Decision nodes: Square, light-green, stroke-width 3
- Value node: Diamond (rhombus), orange, stroke-width 3
- Information sets of chance and decision nodes: Normal arrows
- Information sets of value nodes: Dashed arrows
- Labels:
Node ... <br> States: ...
We can create diagrams programmatically using Mermaid.js:
graph LR
    subgraph Chance and Decision Nodes
        %% Chance nodes
        1((Node: 1 <br> States: 2))
        2((Node: 2 <br> States: 2))
        1 --> 2
        class 1,2 chance

        %% Decision nodes
        3[Node: 3 <br> States: 2]
        4[Node: 4 <br> States: 3]
        1 --> 3
        1 & 2 & 3 --> 4
        class 3,4 decision
    end

    subgraph Value Nodes
        %% Value nodes
        5{Node 5}
        2 & 4 -.-> 5
        class 5 value
    end

    %% Styles
    classDef chance fill:lightblue,stroke:blue,stroke-width:3px;
    classDef decision fill:lightgreen,stroke:green,stroke-width:3px;
    classDef value fill:orange,stroke:darkorange,stroke-width:3px;
Mermaid syntax is explained in the documentation.
Designing influence diagrams is easier using diagrams.net. We can also import Mermaid diagrams to diagrams.net.
We can create mermaid graph using the following code.
using Random
using DecisionProgramming

const Node = Union{ChanceNode, DecisionNode, ValueNode}

function nodes(N::Vector{<:Node}, class::String, edge::String; S::Union{States, Nothing}=nothing)
    lines = []
    for n in N
        if S === nothing
            push!(lines, "$(n.j)[Node: $(n.j)]")
        else
            push!(lines, "$(n.j)[Node: $(n.j) <br> States: $(S[n.j])]")
        end
        if !isempty(n.I_j)
            I_j = join(n.I_j, " & ")
            push!(lines, "$(I_j) $(edge) $(n.j)")
        end
    end
    js = join([n.j for n in N], ",")
    push!(lines, "class $(js) $(class)")
    return join(lines, "\n")
end

function graph(C::Vector{ChanceNode}, D::Vector{DecisionNode}, V::Vector{ValueNode}, S::States)
    return """
    graph LR
    subgraph Chance and Decision Nodes
    %% Chance nodes
    $(nodes(C, "chance", "-->"; S=S))

    %% Decision nodes
    $(nodes(D, "decision", "-->"; S=S))
    end

    subgraph Value Nodes
    %% Value nodes
    $(nodes(V, "value", "-.->"))
    end

    %% Styles
    classDef chance fill:lightblue,stroke:blue,stroke-width:3px;
    classDef decision fill:lightgreen,stroke:green,stroke-width:3px;
    classDef value fill:orange,stroke:darkorange,stroke-width:3px;
    """
end

rng = MersenneTwister(111)

C, D, V = random_diagram(rng, 5, 3, 2, 3, 3)
S = States(rng, [2, 3], length(C) + length(D))
# X = [Probabilities(rng, c, S; n_inactive=0) for c in C]
# Y = [Consequences(rng, v, S, low=-1.0, high=1.5) for v in V]

println(graph(C, D, V, S))
Updated to work with the new version in the interface-update branch and be slightly more visually consistent with the diagrams in our docs.
using Random
using DecisionProgramming
function nodes(diagram::InfluenceDiagram, class::String, edge::String; S::Union{States, Nothing}=nothing)
lines = []
if class == "chance"
N = diagram.C
left = "(("
right = "))"
elseif class == "decision"
N = diagram.D
left = "["
right = "]"
elseif class == "value"
N = diagram.V
left = "{"
right = "}"
else
throw(DomainError("Unknown class $(class)"))
end
for n in N
if S === nothing
push!(lines, "$(n)$(left)Node: $(diagram.Names[n])$(right)")
else
push!(lines, "$(n)$(left)Node: $(diagram.Names[n]) <br> $(S[n]) states$(right)")
end
if !isempty(diagram.I_j[n])
I_j = join(diagram.I_j[n], " & ")
push!(lines, "$(I_j) $(edge) $(n)")
end
end
js = join([n for n in N], ",")
push!(lines, "class $(js) $(class)")
return join(lines, "\n")
end
function graph(diagram::InfluenceDiagram)
return """
graph LR
%% Chance nodes
$(nodes(diagram, "chance", "-->"; S=diagram.S))
%% Decision nodes
$(nodes(diagram, "decision", "-->"; S=diagram.S))
%% Value nodes
$(nodes(diagram, "value", "-.->"))
%% Styles
classDef chance fill:#F5F5F5 ,stroke:#666666,stroke-width:2px;
classDef decision fill:#D5E8D4 ,stroke:#82B366,stroke-width:2px;
classDef value fill:#FFE6CC ,stroke:#D79B00,stroke-width:2px;
"""
end
rng = MersenneTwister(111)
diagram = InfluenceDiagram()
random_diagram!(rng, diagram, 5, 2, 3, 2, 2, [2,3])
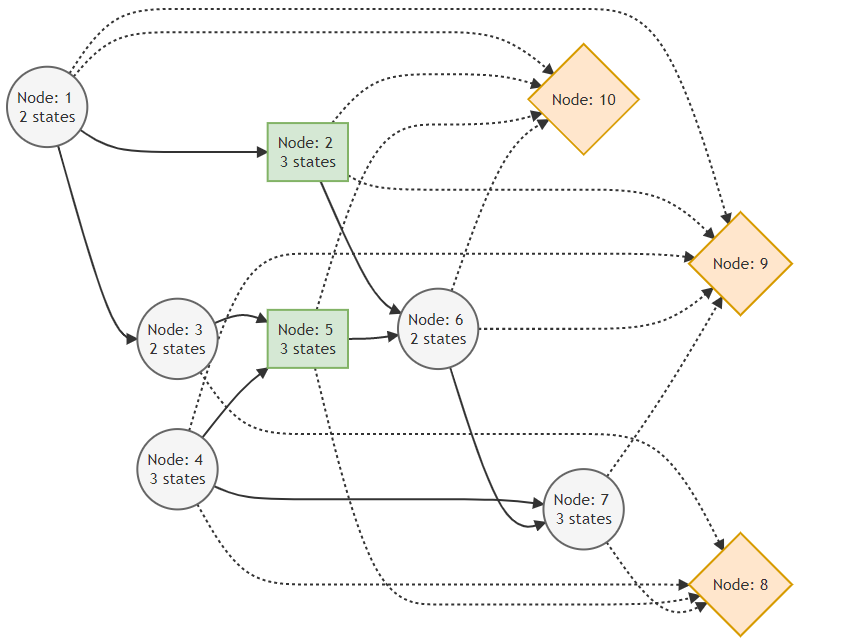
println(graph(diagram))
The result looks like this: