grok_exporter
 grok_exporter copied to clipboard
Progressive CPU usage increase (wanna help)
Hi @fstab, I've taken a look at your issues and many of us has already noted some weird cpu usage behaviour (#120, #58, #64), please feel free to close or merge this issue somewhere else. I just opened it because I don't want to hijack someone else issue. As many already noted there seems to be a kinda strange behaviour "after a while", I mean, if you leave it opened (as a systemd service) dealing with some real production data I can see a constant cpu usage increase (from top utility). It's not reproducible in a matter of minutes but after hours of usage and it seems to be related to the log file it uses, program used memory is fine. I don't want to complain about it and I can help or debug where needed. I'm using real data on real servers (not critical btw...) just to see what happens and I can stress it a lot. I'm now tailing an apache2 log (50/60 Mb/day) and a low usage PostgreSQL db (100 Mb/day). I'm exporting to Prometheus and using grafana for displaying them. I can share yaml files or do some sort of debugging for you even if I cannot share logs (as you may imagine), I'm trying to keep regexps to the bare minimum just to focus on grok agent only.
Do you have any hints or is there something I can test for you to see where bottlenecks are ?
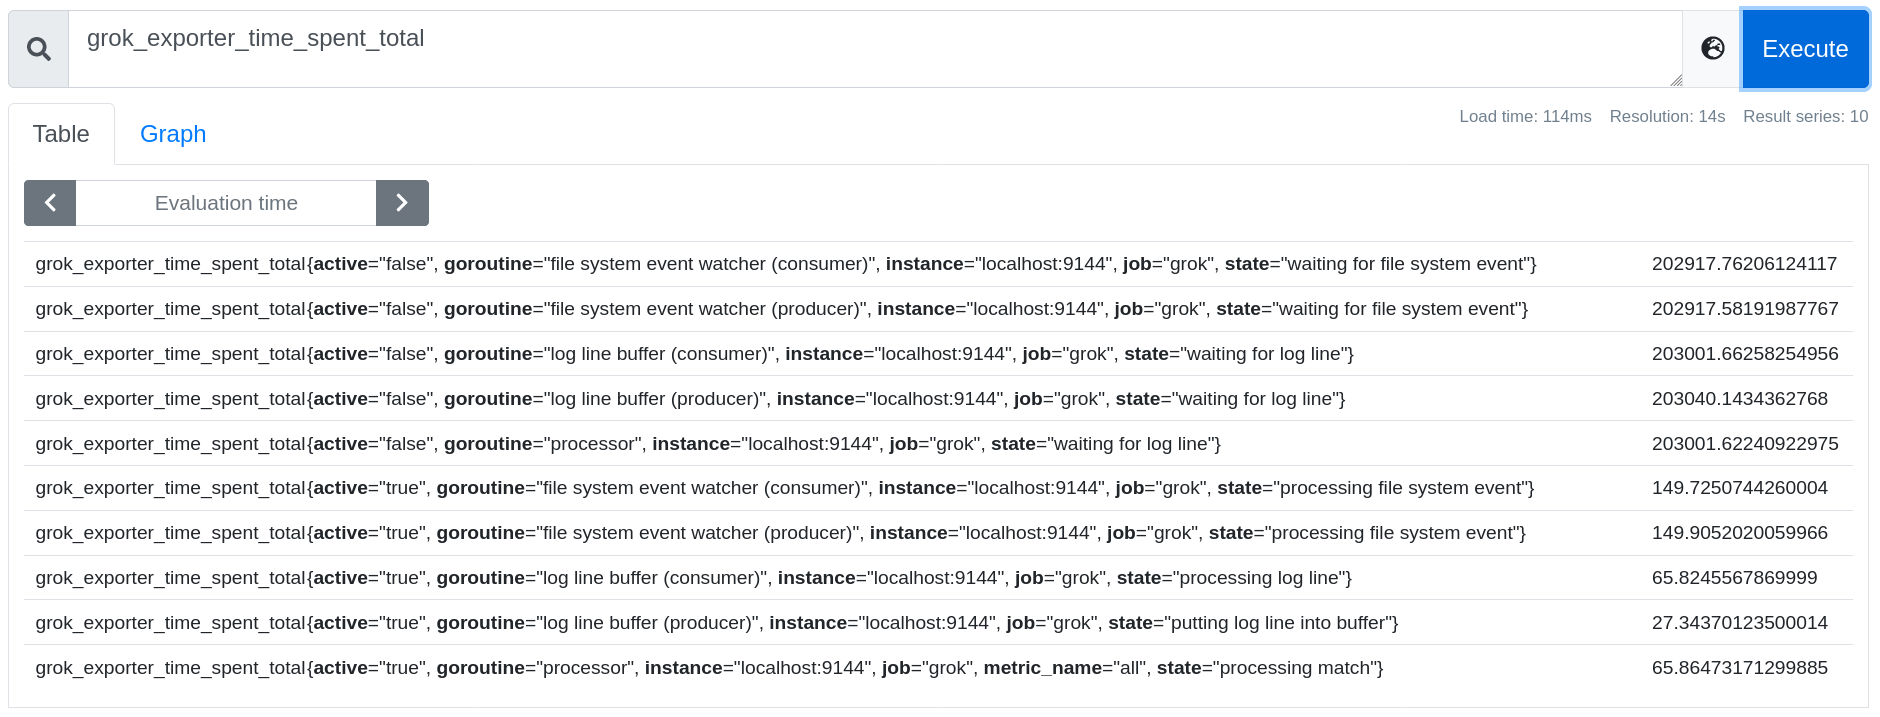
Hi @andreabenini thanks a lot for helping with this. Please build a version of grok_exporter from the built-in-metrics-improvement branch for the investigation. There is a metric named grok_exporter_time_spent_total which hopefully can be used to learn where CPU is spent. It has the following labels:
goroutine
file system event watcher (producer)file system event watcher (consumer)log line buffer (producer)log line buffer (consumer)processor
active:
true: The goroutine is actively computing something (using CPU)false: The goroutine is waiting for something (not using CPU)
state: Homan readable description what the goroutine is doing, like waiting for file system event.
The percentage of time where goroutines are active can be viewed like this:
sum by (goroutine) (rate(grok_exporter_time_spent_total{active="true"}[5m])) /
sum by (goroutine) (rate(grok_exporter_time_spent_total[5m]))
If you find a goroutine using significant CPU please let me know in which state it does that. Or if you find high CPU usage while these percentages are low, then there is a bug in these metrics and you could help me figure out what's wrong.
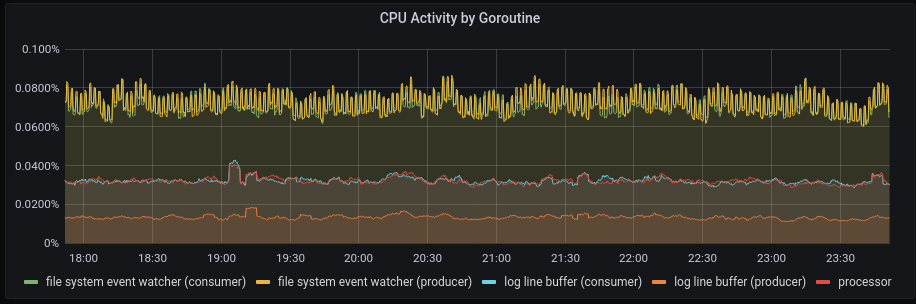
Here's an example what this looks like (active states are well below 1%):
I've fixed the hack/release.sh build process few days ago for my personal tests (see PR), it shouldn't take a lot of time to achieve the same on that branch. I'll definitively do that and report results asap