How can I show a line chart?
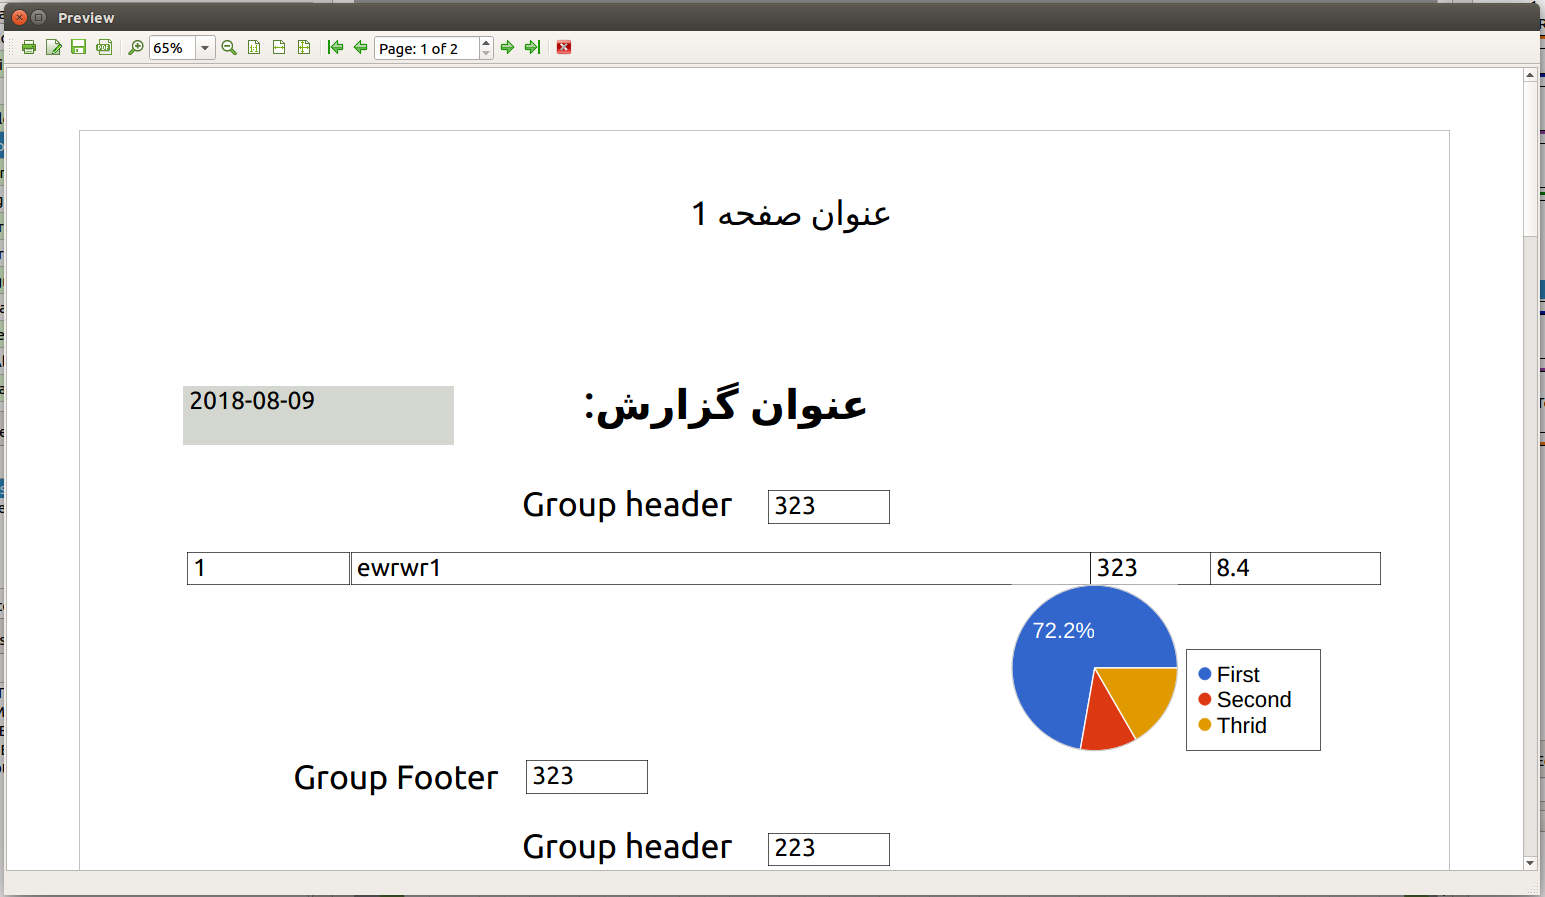
I have tried to add new datasource (as a csv) in designer and set my chart's data source property to it. But when I clicked of Render Report button at the top of designer window, Pie chart is shown without any changes. However all the csv's data are shown in the data section.
 Another problem is that changing it to a line chart. There is no option in ChartType property for bar chart. Although I think I could create another class for line chart in lrchartitem files.
Hi! Have you created a series in the CharItem editor? The editor opens by double-clicking on the chart. Maybe this video will be useful for you https://www.youtube.com/watch?v=6T1VHAhPDt4 When you create the series you can select its type and it may be a line