slow performance when taking a heap snapshot
we should batch work so we don't freeze the ui while a snapshot is being taken and the data is being processed.
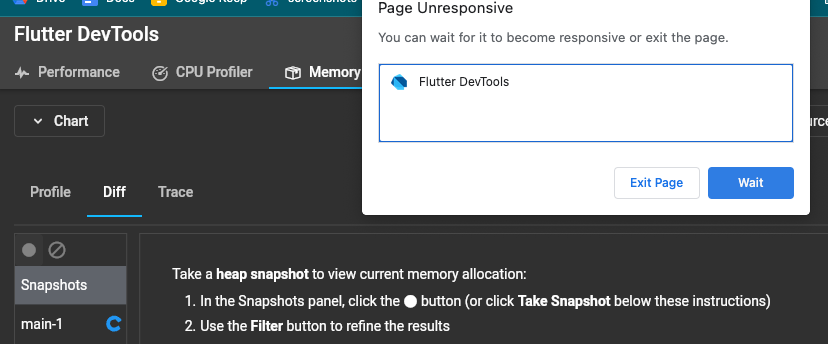
I just encountered this action taking 30+ seconds to finish. It took so long that the Chrome "this page has become unresponsive" message popped up:
Raising the priority of this, as 30 seconds is a pretty poor experience. The loading spinner froze, so that means we likely need to split the work up into batches in addition to improving the overall performance of the operation.
raising the priority of this. I just tried to take a heap snapshot from a dart command line application (the web-test app that @CoderDake uses), and it took over a minute. The second snapshot took more than 2 minutes.
I was running DevTools in profile mode on the web flutter run -d chrome --profile, and the test app was a dart cli app.
The performance of taking a snapshot is still very slow. I'm running gallery on an iOS simulator and it took 20 seconds to take a snapshot. This work is hogging the UI thread and stalling the DevTools UI. We need to find a way to optimize this. Maybe we can look into using flutter compute if it can now return non primitive types: https://api.flutter.dev/flutter/foundation/compute.html
It is not possible to do on flutter web: https://github.com/flutter/flutter/issues/33577 So, I suggest to postpone this till resolution of the issue. Reducing priority to P2 for now.
This is still worth investigating to see if there is any way we can improve the performance without using compute. 30+ seconds is really long to ask users to wait.
Sometimes it's much longer. I took a snapshot earlier; probably took more than 5 minutes. I'm right now waiting for a second snapshot; it's been going for like 5, maybe 15 minutes.
Via https://github.com/flutter/devtools/issues/5944, I ran devtools as a native app. I did manage to get two snapshots, though maybe I was just faster to click the snapshot button and my app didn't have as much time to build up references. One thing I notice, though, is that taking snapshots and exporting a CSV diff can cause devtool's memory usage to swell rapidly out of control - like 25GB (maxing out my system) in a minute or two. My app only uses like, a few hundred MB. Devtools says the snapshots are ~100MB.