devtools

devtools copied to clipboard
"Average FPS" is calculated wrongly - for example, a 30FPS case is reported ~45FPS
Suspected cause
The FPS should be calculated as "how many frames (i.e. new pictures) are shown on the screen per second", instead of "how long does the ui thread take to compute one frame", because the latter forgets the idle time in the ui thread also counts.
Description
Run the code (better in profile mode)
import 'dart:io';

import 'package:flutter/material.dart';
import 'package:flutter/scheduler.dart';

void main() => runApp(MyApp());

class MyApp extends StatefulWidget {
  @override
  State<MyApp> createState() => _MyAppState();
}

class _MyAppState extends State<MyApp> {
  var count = 0;

  @override
  Widget build(BuildContext context) {
    sleep(const Duration(milliseconds: 17));
    count++;
    SchedulerBinding.instance.addPostFrameCallback((_) => setState(() {}));
    return MaterialApp(home: Scaffold(body: Center(child: Text('$count'))));
  }
}
Open devtool and see: (notice it says "45fps")
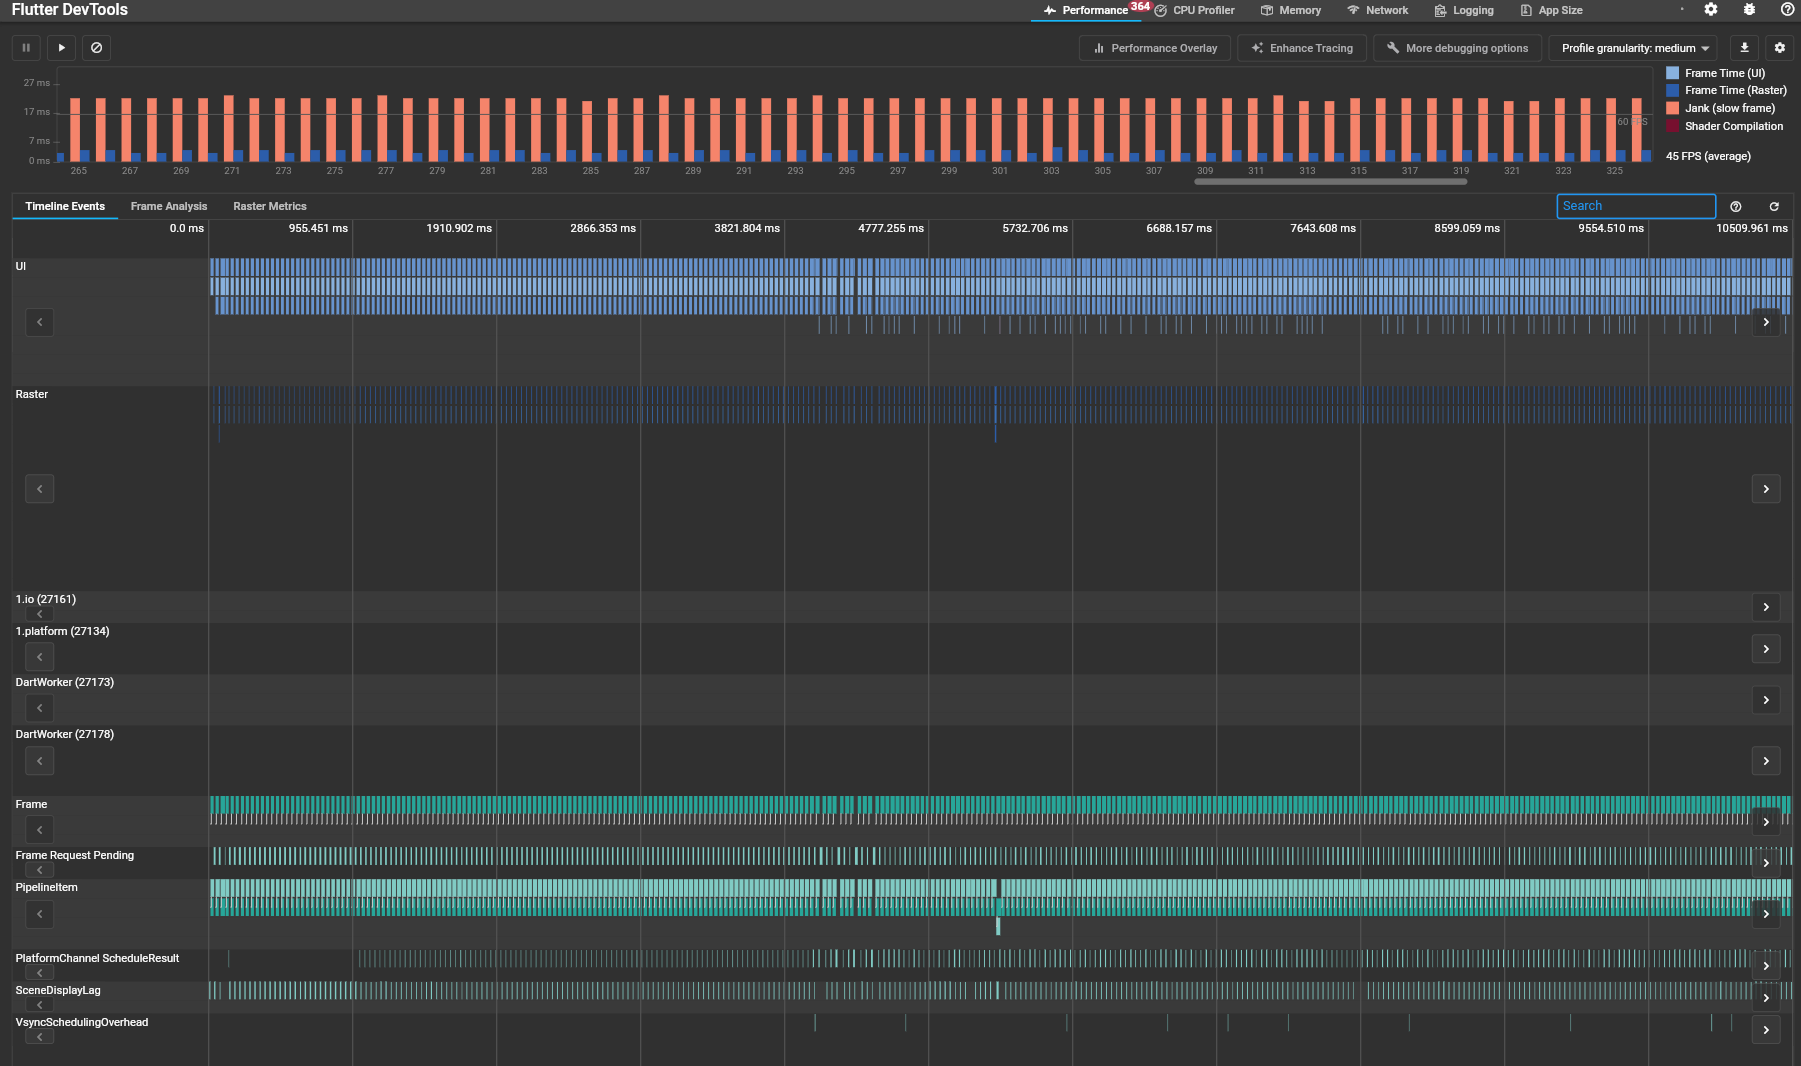
zoom in and see: (left of "1" is 1244325196370 μs, left of "2" is 1244325497120 μs)

By simple math, (1244325497120-1244325196370)/9 = 33.416ms, we know between each rasterization there are nearly 33.416 ms. This is exactly 33.333ms which is 30FPS!
Thus, in this simple example, it should say 30FPS but wrongly report 45FPS.