devtools

devtools copied to clipboard
DevTools performance pane functionality should be on-par with Observatory
See Observatory -> DevTools Tracking Issue.
Performance tooling functionality from Observatory that’s not present in DevTools:
- [ ] Changing between code/function CPU profiles
- [ ] Call tree filtering
- [ ] Tag ordering (VM, User, None)
- [ ] Last refresh time / other profiler stats
- [ ] Go-to source from tree entry
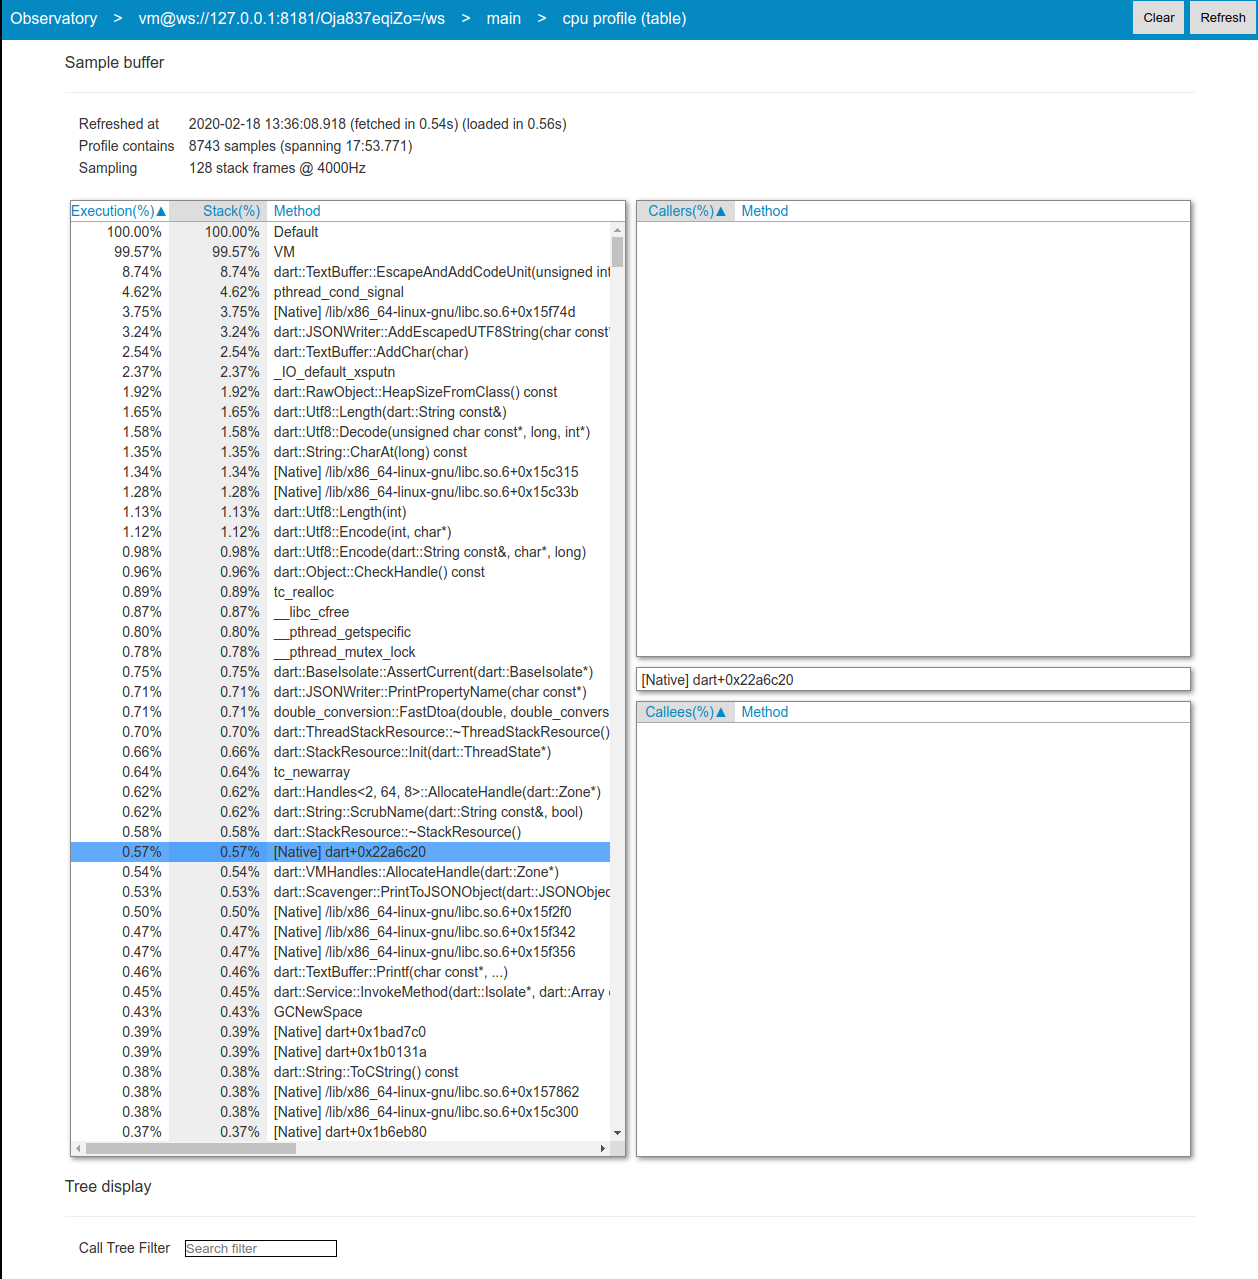
- [ ] Method table view
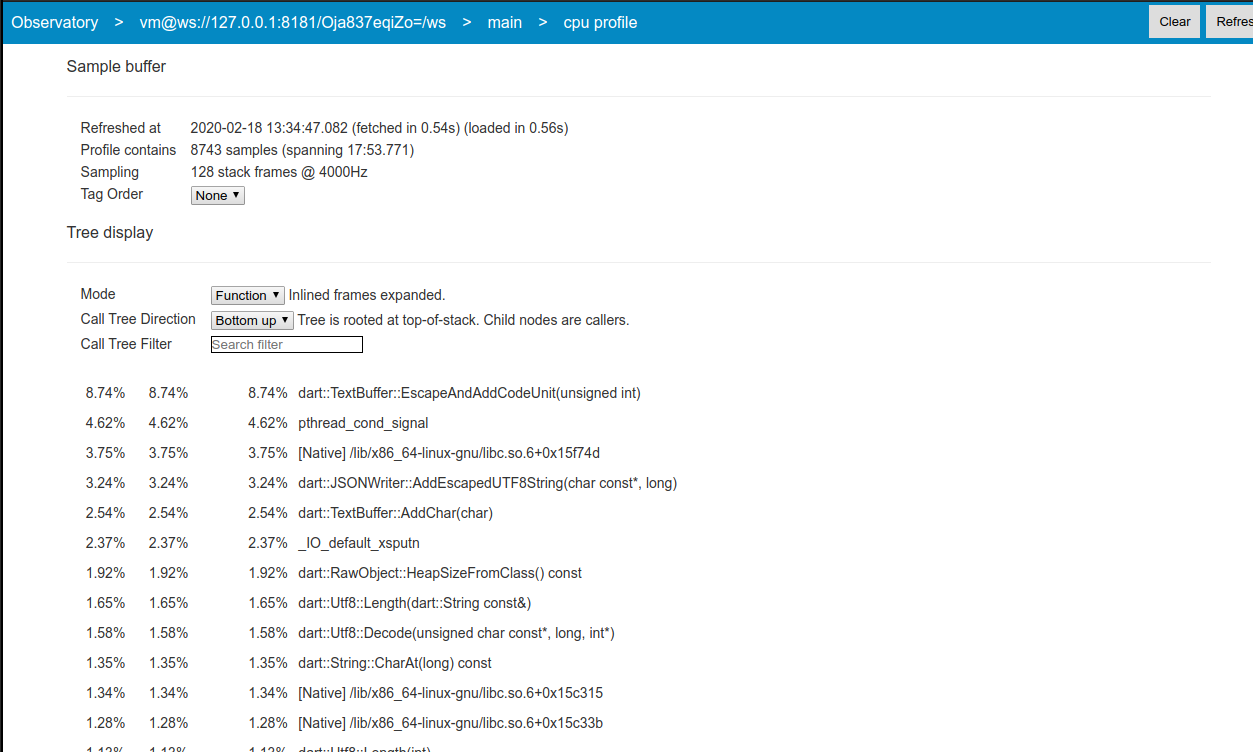
Observatory CPU Profile View
Observatory CPU Profile Method Table View