devtools

devtools copied to clipboard
DevTools should display GC and native memory allocation statistics in the memory pane
See Observatory -> DevTools Tracking Issue.
DevTools should allow for inspecting the following data in the memory pane:
- [x] New + old space statistics
- [ ] GC statistics
- [ ] Native memory allocations
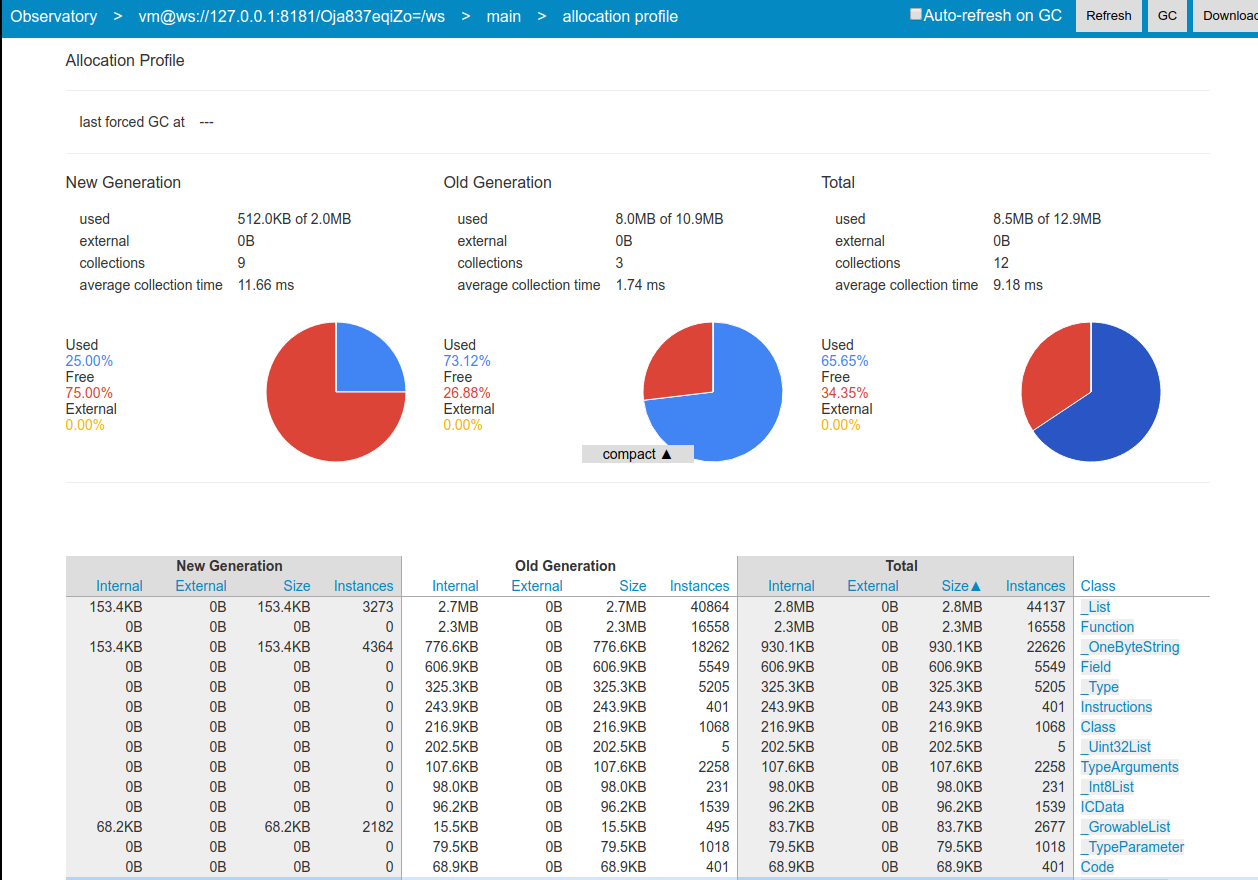
Observatory Allocation Profile
@rmacnak-google are we interested in surfacing GC statistics (e.g., # of collections and average collection time)?
We're no longer surfacing native memory allocation profiles in the VM, so this is complete.