Audit bottom up total time / self time logic - are they always the same?
Hi,
just observed that the total time in the BottomUp View doesn't match that of the CPU Flame chart. On a closer look it turns out that currently on the bottom up view the total time is always equal to the Self Time. Maybe I understand the graph just wrong but what is it good ?
Cheers Thomas
Total time for the Bottom Up view is expected to be different than the CPU flame chart. The definitions for total / self time are slightly different for Bottom Up and Call Tree.
I'd encourage you to read the definitions at the provided links to understand the differences. Thanks!
I read it and this here is stated:
Total time
Time the method spent executing its own code as well as the code for its callee.
Which I read (maybe a language issue) its the time of the method plus the time of all the methods that method calls. Am I wrong.
Besides that if both times are always the same, it might make sense not to show both columns.
You are correct. One small clarification though - for a the bottom up chart, each "caller" will only have one "callee" (the node up one level in the tree hierarchy).
Call Tree
A
 |__ B
       |__ C
Bottom Up
C
 |__ B
       |__ A
So for the bottom up chart, the total time for node A will be the time spent executing A(caller) as well as the time spent executing B (the callee).
Self time and Total time should not always be the same. I'll reopen this issue to track auditing that to make sure that we do not have a bug in our calculation logic.
So does the total time of B consist of the self time of B + the self time of C but does not contain any other methods B might call?
I guess I'm not sure what the value of the bottom up view is, perhaps this could be explained a bit more in the docs.
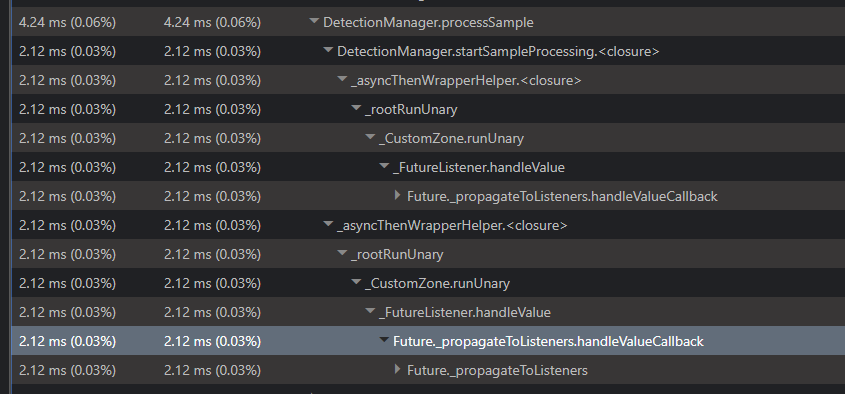
Here is another example where self and total time is always the same
Correct. In the bottom up chart, we care more about patterns at the bottom of the call tree (or the top of the call stack if you want to view it that way).
Call Tree
A
 |__ B
       |__ C
D
 |__ E
       |__ C
F
 |__ B
       |__C
Bottom Up
C
 |__ B
 |     |__ A
 |     |__ F
 |__ E
       |__ D
Here, the bottom up chart allows us to see that we have several samples whose leaf node is C. Since we are spending a lot of CPU time in C, perhaps we should try to optimize that method to improve performance.
The bottom-up total/self calculations shouldn't always be the same, so there's definitely something wrong here. Should have a fix up in https://github.com/flutter/devtools/issues/1033.