Cannot use debug breakpoint tool on VSCode
When I config this code in serverless.yml, I cannot use debugger breakpoint on VSCode.
  esbuild:
    bundle: true
    minify: true
    sourcemap: true
    keepNames: true
Hey @sinh117801, not quite sure what you mean. How are you running it? Can you give us a example?
@sinh117801 here's what I used to get VSCode debugging with this plugin:
Add a launch configuration that starts serverless offline with the debugger attached:
  "launch": {
        "configurations": [
            {
                "type": "node",
                "request": "launch",
                "name": "Debug Lambdas - Launch",
                "sourceMaps": true,
                "program": "${workspaceFolder}/node_modules/serverless/bin/serverless.js",
                "args": [
                    "offline",
                    "--config", "serverless.ts", // or serverless.yml, whatever you use
                    "--stage", "your-stage"
                ],
            }
        ]
    }
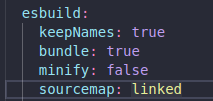
I had to disable minification when debugging, I couldn't inspect values of local variables otherwise. So put minify: false (if I'm missing something, do put a comment here). I also had to put sourcemap to 'linked'; external did not work for me, VSCode wouldn't load the sourcemaps. So my config is this one:
    esbuild:
      minify: false
      sourcemap: linked
      keepNames: true
@sinh117801 here's what I used to get VSCode debugging with this plugin:
Add a launch configuration that starts serverless offline with the debugger attached:
  "launch": {
        "configurations": [
            {
                "type": "node",
                "request": "launch",
                "name": "Debug Lambdas - Launch",
                "sourceMaps": true,
                "program": "${workspaceFolder}/node_modules/serverless/bin/serverless.js",
                "args": [
                    "offline",
                    "--config", "serverless.ts", // or serverless.yml, whatever you use
                    "--stage", "your-stage"
                ],
            }
        ]
    }
I had to disable minification when debugging, I couldn't inspect values of local variables otherwise. So put
minify: false(if I'm missing something, do put a comment here). I also had to put sourcemap to 'linked'; external did not work for me, VSCode wouldn't load the sourcemaps. So my config is this one:esbuild: minify: false sourcemap: linked keepNames: true
Thanks @coyoteecd. I really appreciate this. I will try it.
guys, all right.
I tried the same configuration but with "linked"
it doesn't work, I've already used some configurations but to debug correctly with esbuild I'm not succeeding.
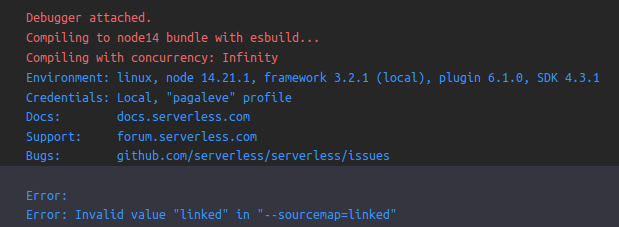
if using config sourcemap: true it generates the .map but even so the breakpoint execution is still intermittent.
Has anyone ever experienced this ?
Hi guys! 👋🏻 i have the same issue and i can't use the plugin with vscode debugger. I mean the breakpoints don't stop the execution. Also i tried all configuration you mention before without success.
I share this repo where you can reproduce the case.
If i comment the serverless-esbuild in serverless.yml the vscode debugger works fine!
Pointing the outFiles of your launch configuration to ${workspaceFolder}/.esbuild/.build/**/*.js worked for me:
{
	"type": "node",
	"request": "launch",
	"name": "Debug",
	"preLaunchTask": "tsc: build - tsconfig.json",
	"program": "${workspaceFolder}/node_modules/.bin/sls",
	"console": "integratedTerminal",
	"runtimeVersion": "18.7.0",
	"runtimeArgs": ["--lazy"],
	"runtimeExecutable": "node",
	"args": [
		"offline",
		"-c", "serverless.ts",
		"--noTimeout",
		"--stage", "dev",
		"--region", "us-east-1",
		"--noAuth"
	],

	"outFiles": [
		"${workspaceFolder}/.esbuild/.build/**/*.js" // 👈 This is the important line, added `.esbuild`
	],
	"windows": {
		"program": "${workspaceRoot}\\node_modules\\serverless\\bin\\serverless",
	},
	"autoAttachChildProcesses": true,
	"sourceMaps": true,
	"smartStep": true
}
I also noticed that setting serverless.ts -> custom -> esbuild -> exclude to [] prevents it from working:
// serverless.ts
custom: {
  esbuild: {
      bundle: true,
      minify: false,
      sourcemap: true,
      keepNames: true,
      // exclude: [],   👈👈👈👈  comment this out
      target: 'node18',
      define: { 'require.resolve': undefined },
      platform: 'node',
      concurrency: 10,
    },
}
Is there any accepted solution @floydspace?
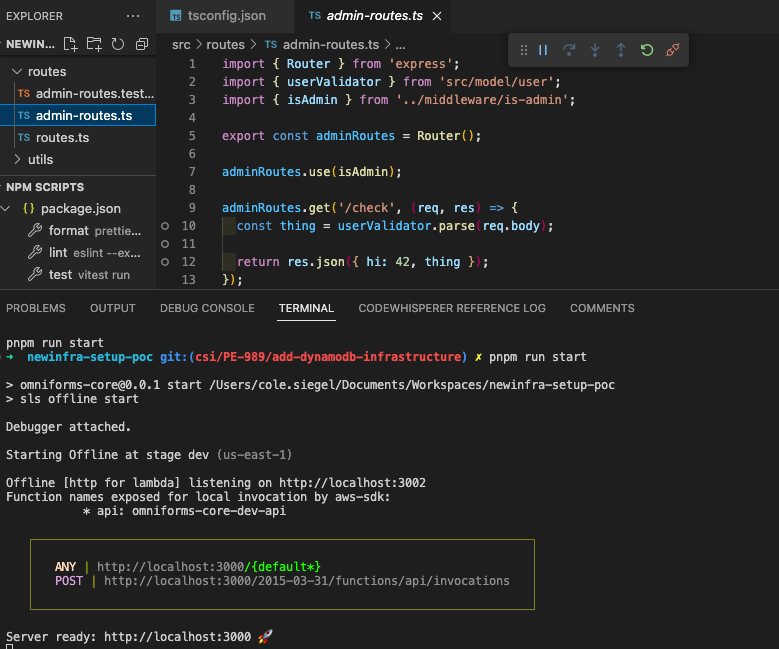
None of the approaches here worked for me.
When I attach the debugger, breakpoints remain unbound:
@sinh117801 here's what I used to get VSCode debugging with this plugin:
Add a launch configuration that starts serverless offline with the debugger attached:
  "launch": {
        "configurations": [
            {
                "type": "node",
                "request": "launch",
                "name": "Debug Lambdas - Launch",
                "sourceMaps": true,
                "program": "${workspaceFolder}/node_modules/serverless/bin/serverless.js",
                "args": [
                    "offline",
                    "--config", "serverless.ts", // or serverless.yml, whatever you use
                    "--stage", "your-stage"
                ],
            }
        ]
    }
I had to disable minification when debugging, I couldn't inspect values of local variables otherwise. So put
minify: false(if I'm missing something, do put a comment here). I also had to put sourcemap to 'linked'; external did not work for me, VSCode wouldn't load the sourcemaps. So my config is this one:esbuild: minify: false sourcemap: linked keepNames: true
This worked for me but only after making a request, the first request breakpoints are unbound and they become bound after a test request. Any ideas what might cause this?
This worked for me but only after making a request, the first request breakpoints are unbound and they become bound after a test request. Any ideas what might cause this?
Happens to me too
This worked for me but only after making a request, the first request breakpoints are unbound and they become bound after a test request. Any ideas what might cause this?
Also seeing the same thing.
Having this same issue
This worked for me but only after making a request, the first request breakpoints are unbound and they become bound after a test request. Any ideas what might cause this?Happens to me too
Same thing with me
I had to ensure that the --data flag was present in my launch.json. Without it, the VSCode debugger wasn't stopping on my breakpoints
guys, all right.
I tried the same configuration but with "linked"
it doesn't work, I've already used some configurations but to debug correctly with esbuild I'm not succeeding.
if using config sourcemap: true it generates the .map but even so the breakpoint execution is still intermittent.
Has anyone ever experienced this ?
This work for me, thanks very much.
As many of you, I too observer the issue, whereby the breakpoints are unbound when starting the debug script.
Looking at the Call Stack, in VSC - I noticed that, there is a worker that gets invoked after my first lambda invocation.
| before | after |
|---|---|
It would appear, that when the debugger starts, it is not aware of the "application".
This is due to us inspecting serverless offline which until the lambda it's running has been invoked is not aware of its code.