Low latency API endpoint to check a user's policy compliance to enable Zero Trust
Goal
Customers need a low-latency, scalable, and rapidly-updated API route that that tells them which policies are passing and failing for a particular host. This enables Zero Trust use cases. Under a Zero Trust regime, the customer's identity provider will be pinging this API frequently to ask it whether the user is in compliance. Thus, the endpoint must be:
- low-latency so that this ping will not slow down the end user's work
- scalable so that it can accommodate many requests per second for large companies
- rapidly-updated so that users are blocked promptly when they fall out compliance with policies.
- rapidly-updated so that the API unblocks users promptly after they click "refetch" to confirm that they've fixed the problem.
If the rollout of the Zero Trust regime significantly impacts the end user's work experience, this is a large risk because it stops all work at the company for a day and damages the team's reputation.
Requirements
- Measure the scalability and latency of the endpoint at 100,000 req/min (100k employees * 1 req/min/employee)
- Scalability: do we notice high instance utilization and/or performance issues?
- Latency: do we notice it takes a long time to get a response back when there is load, thereby holding up the end user? Goal: < 1s
Related
- Parent epic: https://github.com/fleetdm/fleet/issues/7186
@tgauda would you ask our relevant customers the above questions? I think that would help eng understand what level of performance we need to achieve.
Tested in loadtesting environment with Using vegeta and a loadtesting environment with 20K hosts
token=""

# 100000 req/min = 1667 req/sec
jq -ncM "1 | while(true; .+1) | {method: \"GET\", url: (\"https://michal.loadtest.fleetdm.com/api/latest/fleet/hosts/\" + (. % 20000 | tostring)), header: {\"Authorization\": [\"Bearer ${token}\"]}}" | \
  vegeta attack -rate=1667/s -lazy -format=json -duration=30s | \
  tee results.bin | \
  vegeta report
Requests      [total, rate, throughput]         200040, 1667.01, 429.68
Duration      [total, attack, wait]             2m30s, 2m0s, 29.965s
Latencies     [min, mean, 50, 90, 95, 99, max]  370.433ms, 26.448s, 30s, 30s, 30.001s, 30.006s, 30.085s
Bytes In      [total, mean]                     2944938583, 14721.75
Bytes Out     [total, mean]                     0, 0.00
Success       [ratio]                           32.21%
Status Codes  [code:count]                      0:135595  200:64436  404:9
...
Looking at AWS console metrics for the fleet service, the cpu usage reaches 100% and the memory usage reaches 17%. The logs show a lot of errors containing "context canceled" which suggests that requests are timing out, probably due db queries taking too long. Should investigate further to see which queries are problematic when fetching hosts.
level=error ts=2022-08-01T22:23:32.903915468Z component=http [email protected] method=GET uri=/api/latest/fleet/hosts/7702 took=29.374641501s err="get packs for host: listing hosts in pack: context canceled"
The GET /api/latest/fleet/hosts/{id} endpoint makes multiple queries to the database and returns a lot of data. If only the passing/failing policies are needed, then it may make sense to add a separate endpoint GET /api/latest/fleet/hosts/{id}/policies that would be faster.
- rapidly-updated so that users are blocked promptly but perhaps more importantly, users are unblocked promptly after they fix the problem
Policies are updated based on FLEET_OSQUERY_POLICY_UPDATE_INTERVAL which defaults to 1hr. Decreasing this value may lead to a large performance impact. A reasonable value might be 5m, but this should be tested.
@michalnicp Is the endpoint we are using as minimal as possible? If we made a new endpoint that just returns a true/false, would that improve things?
Also, good point about the second piece there. I think we can rely on users to click the "refetch" button, so that could be ok. My intent in that point was to make sure that the API is updating rapidly after the user clicks refetch. I've updated the main description to more clearly reflect that.
Yes, adding a new endpoint that only returns policy results would probably improve performance.
- rapidly-updated so that the API unblocks users promptly after they click "refetch" to confirm that they've fixed the problem.
The API will return the new policy results as soon as the host/endpoint runs the policy queries again and posts new results to fleet. Again, this is based on FLEET_OSQUERY_POLICY_UPDATE_INTERVAL https://fleetdm.com/docs/deploying/configuration#osquery-policy-update-interval. There is no caching as far as I know. There is currently no way to bypass this interval and force a specific host to update sooner.
@michalnicp just to confirm, even when the user clicks "refetch" in their "my device" page, it will not be updated in the API near-immediately. Instead it will still update as per FLEET_OSQUERY_POLICY_UPDATE_INTERVAL?
ok thanks. I think this is gonna be a UX problem in order for us to enable zero trust. A user should be able to fix their policies and then get going with their work ASAP. Shouldn't have to wait. The wait makes this not make sense, I think. Thank you for raising this. It's good that we surfaced this before going in on it.
cc: @zwass
My understanding of refetches differs from @michalnicp. Policies are checked on refetch.
Check out this demo: https://www.loom.com/share/9ae338f41e8e4e7d89cfdfb1b848adfc
Yes, I wasn't aware of the refetch requested flag on hosts. The update would still depend on the distributed_interval interval which defaults to 10s. Therefore, we would expected the policies to be updated around that time as well.
Did some more investigation once Elastic APM was back up. Noticed that there was a lot of time spent executing on the following sql query
UPDATE
    sessions
SET
    accessed_at = ?
WHERE
    id = ?
This is found in server/datastore/mysql/sessions.go MarkSessionAccessed which is used in middleware on every authenticated request (non osquery endpoints). Because the same auth token was used when loadtesting, this led to locking when trying to update the accessed_at timestamp on the session from many concurrent requests. Changing this function to a noop revealed further issues. We should consider creating an issue to address this ie determine if we really need to do this or optimize it to reduce locking issues.
After the change to sessions. Stats were collected for fleet and the database. For these tests, the following loadtest environment was used
- 10 fleet instances - 4096 MB of memory and 1024 cpu units
- 20000 simulated osquery hosts
- 2 RDS Aurora MySQL instances (5.7.mysql_aurora.2.10.0) running on db.r6g.4xlarge instances. 1 write and 1 replica.
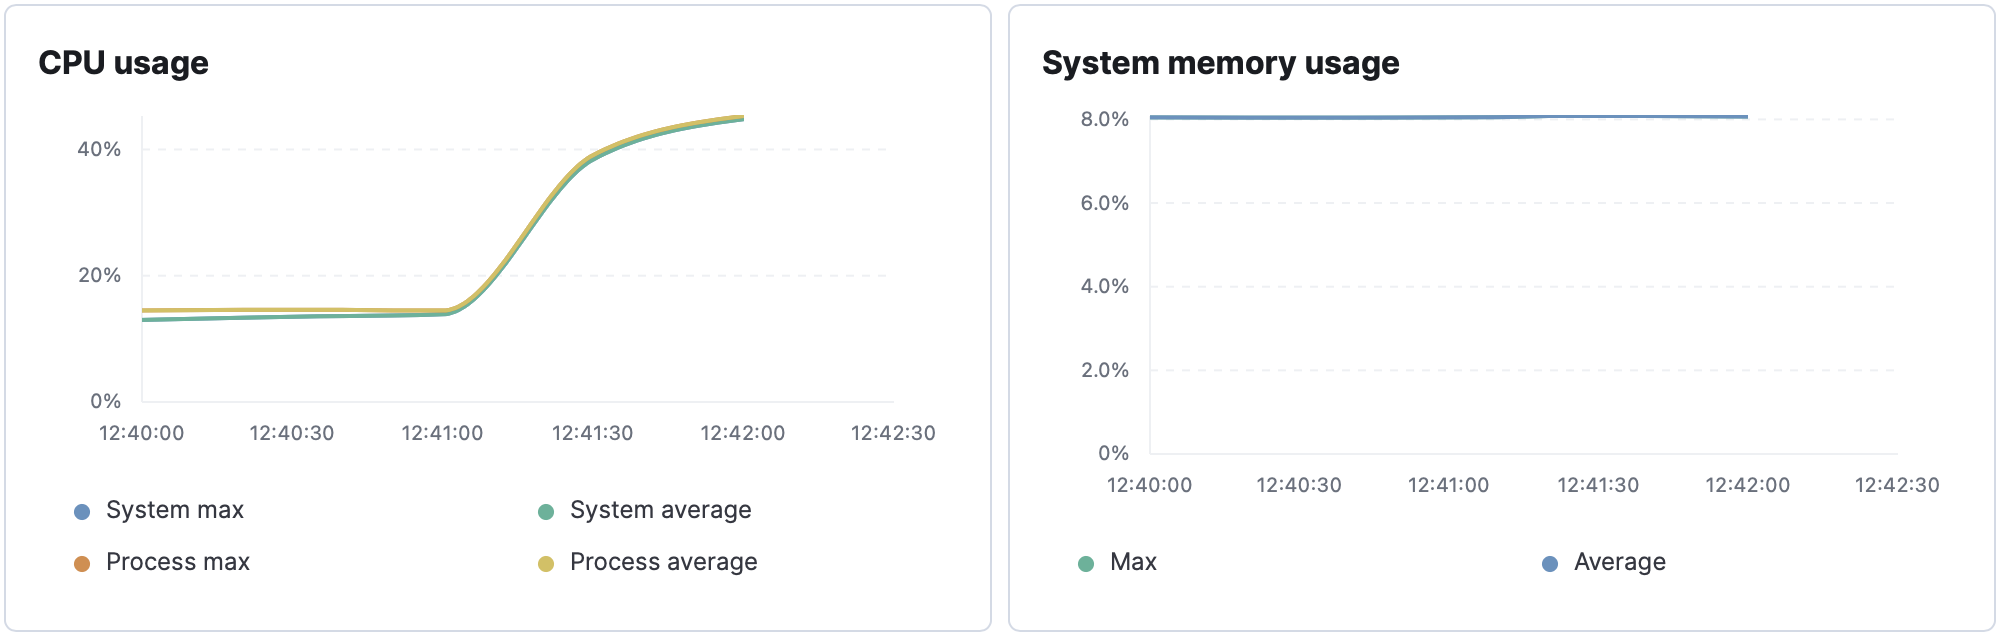
500 requests/second
Requests      [total, rate, throughput]         30000, 500.02, 484.67
Duration      [total, attack, wait]             1m2s, 59.998s, 1.898s
Latencies     [min, mean, 50, 90, 95, 99, max]  66.442ms, 2.537s, 2.341s, 4.6s, 5.279s, 6.79s, 8.951s
Bytes In      [total, mean]                     1377230805, 45907.69
Bytes Out     [total, mean]                     0, 0.00
Success       [ratio]                           100.00%
Status Codes  [code:count]                      200:29999  404:1
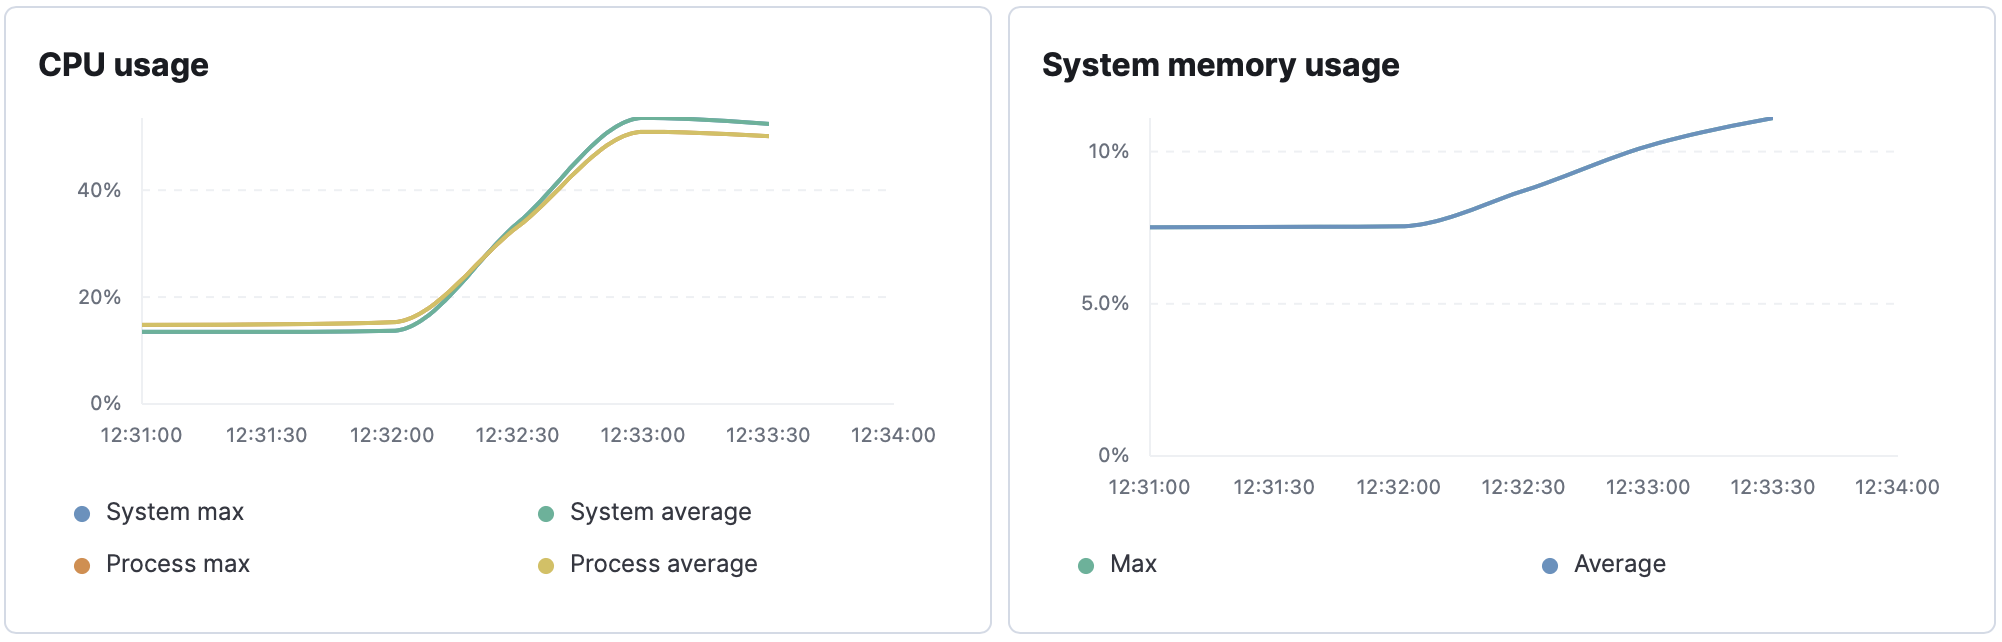
1000 requests/second
Requests      [total, rate, throughput]         60000, 1000.02, 680.25
Duration      [total, attack, wait]             1m27s, 59.999s, 26.584s
Latencies     [min, mean, 50, 90, 95, 99, max]  310.365ms, 10.802s, 9.483s, 20.689s, 24.662s, 30s, 30.068s
Bytes In      [total, mean]                     2702757111, 45045.95
Bytes Out     [total, mean]                     0, 0.00
Success       [ratio]                           98.16%
Status Codes  [code:count]                      0:1099  200:58898  404:3
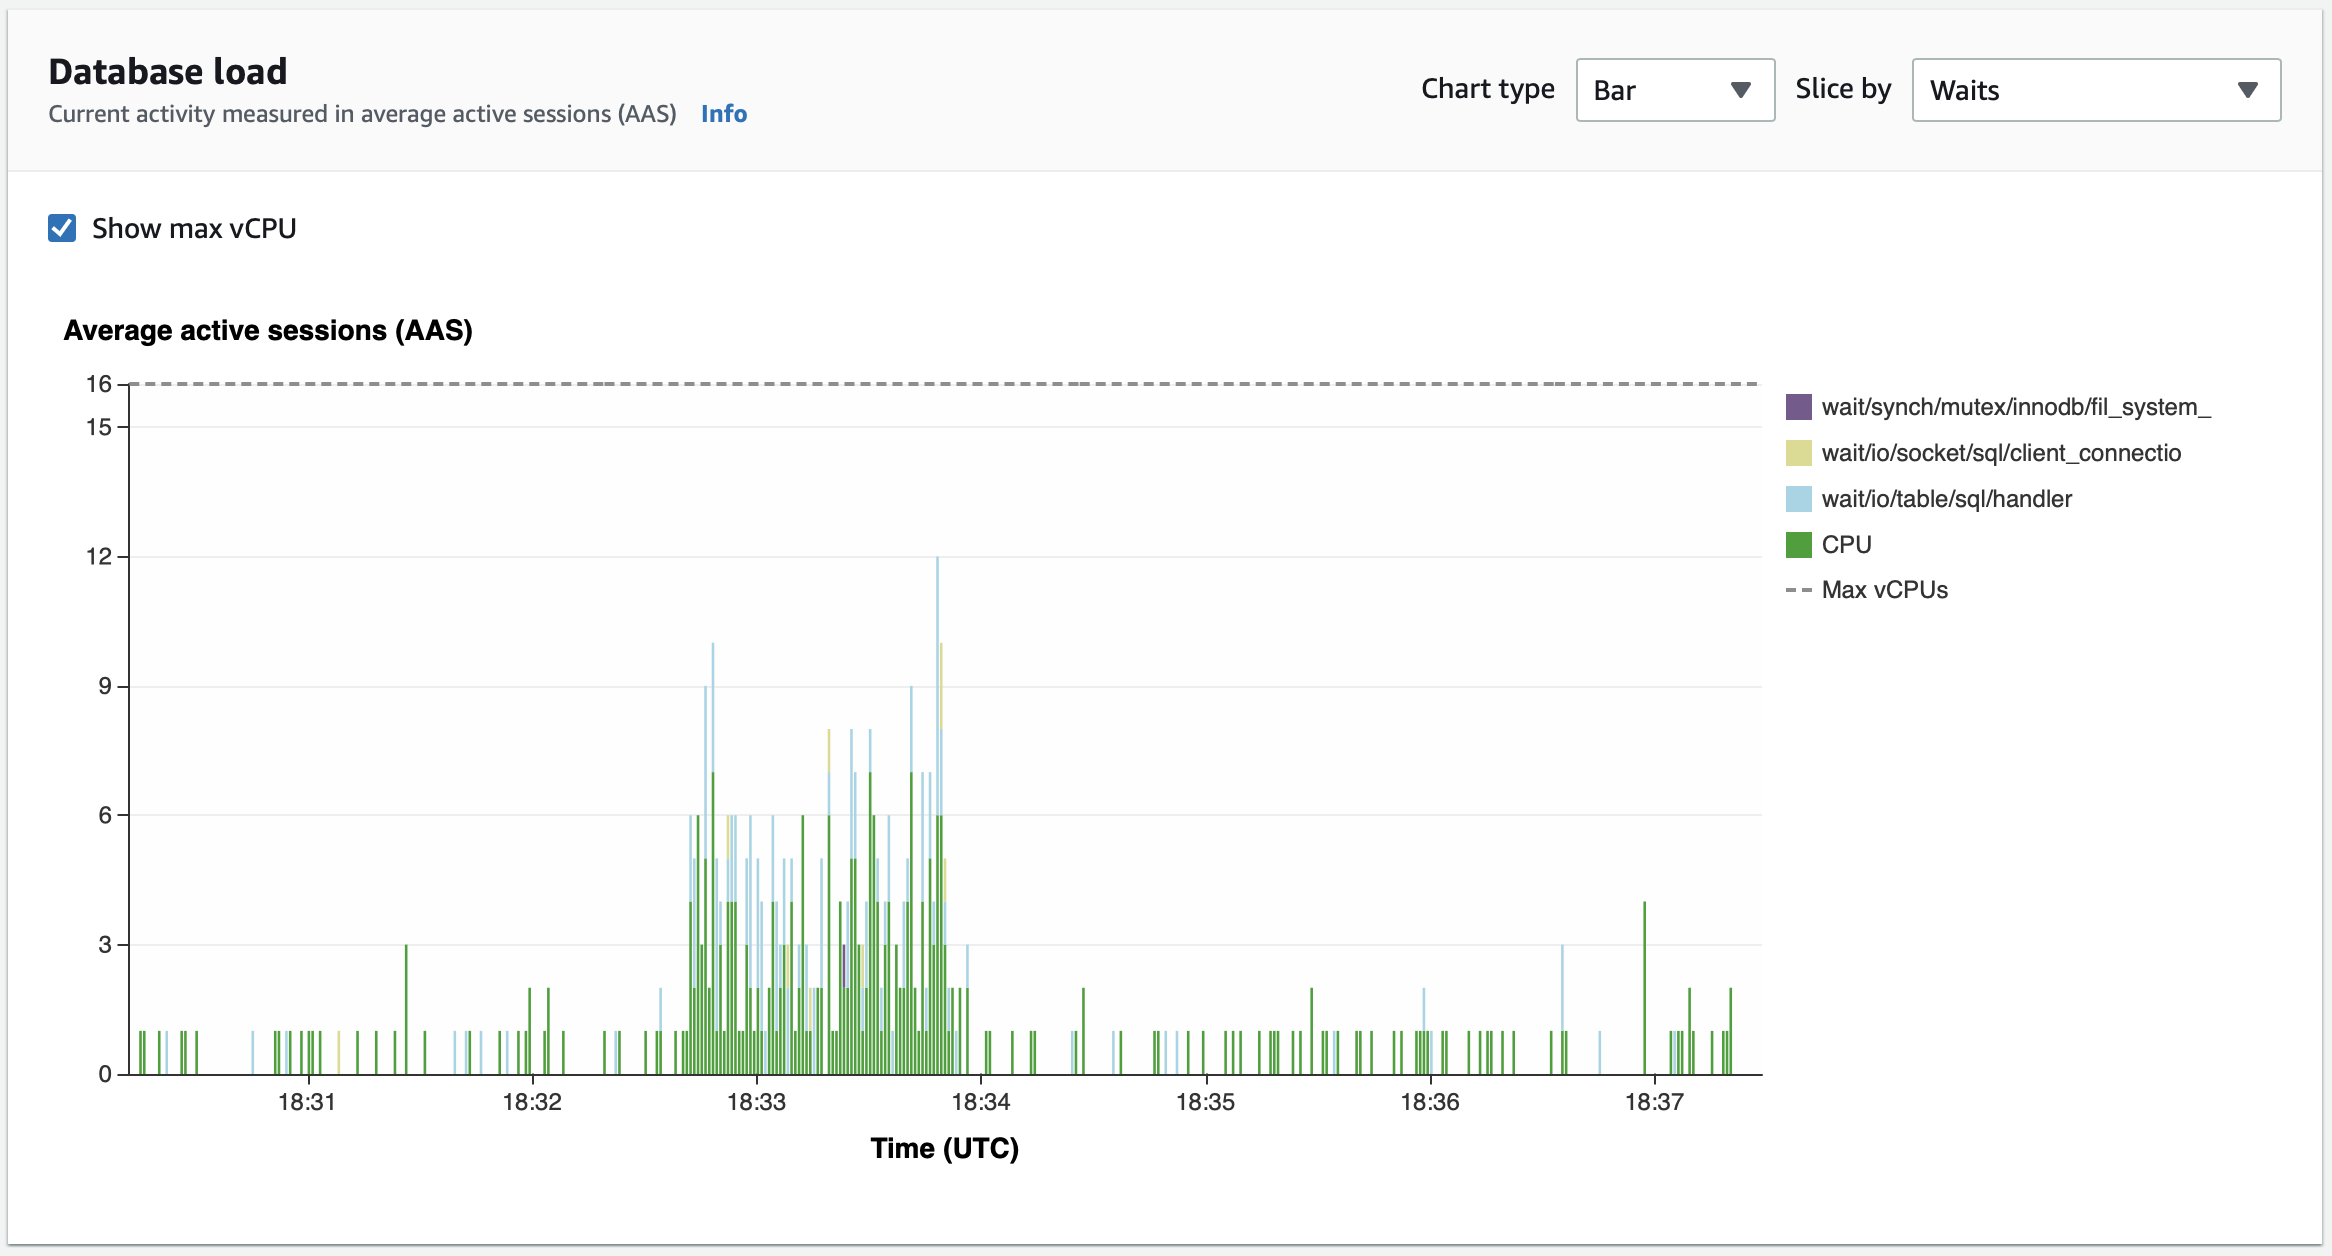
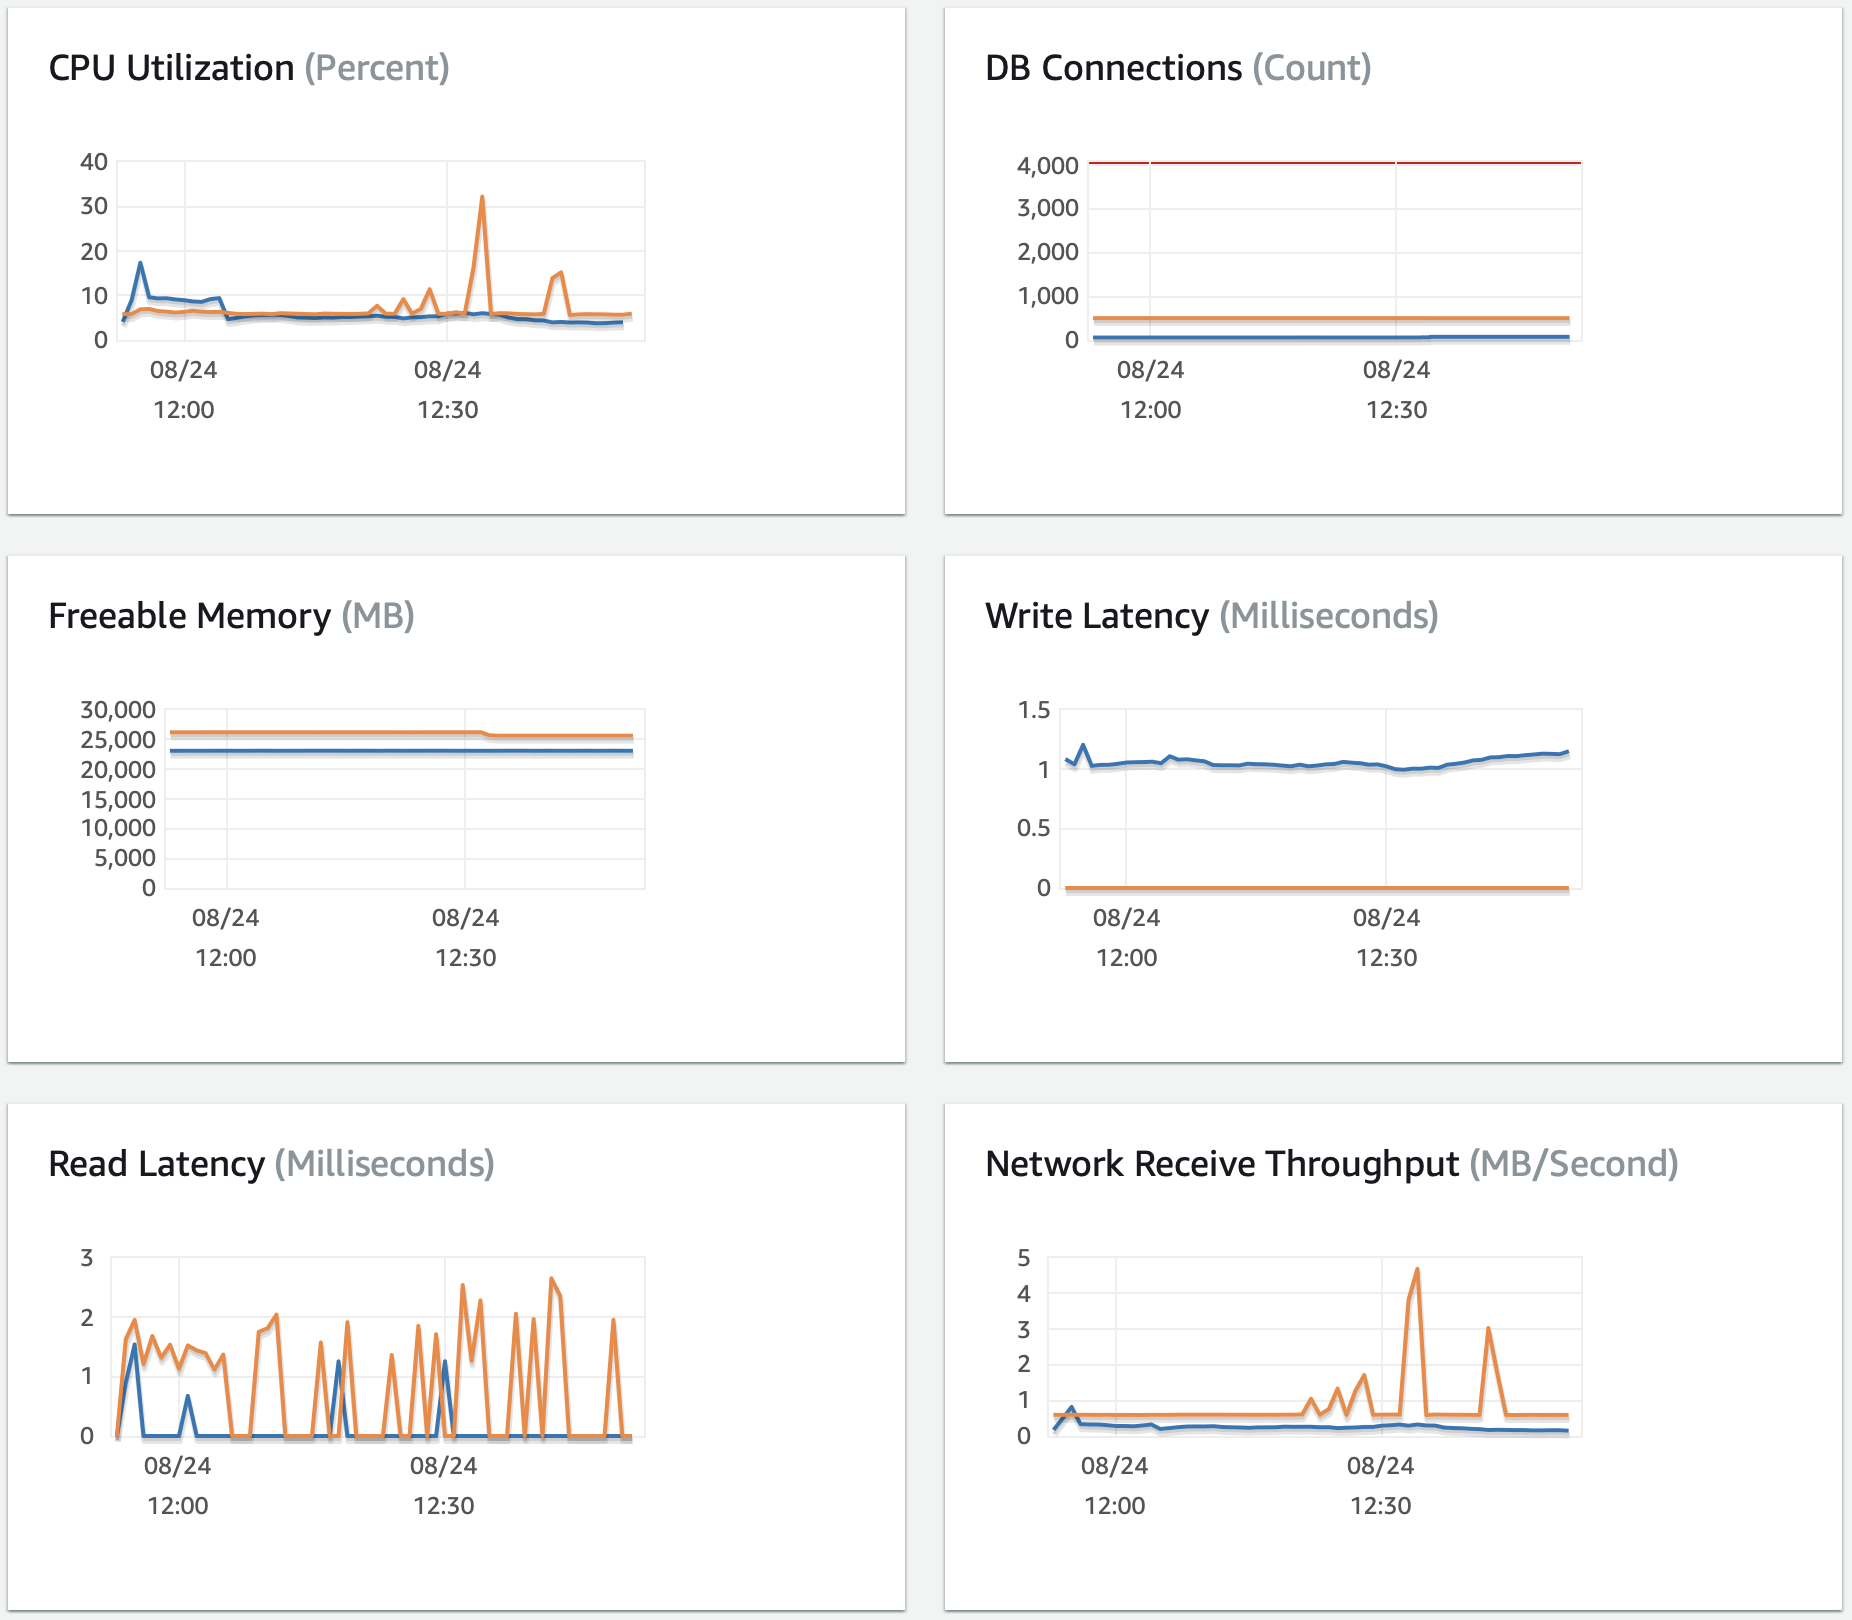
Database load
At peak load, the database seems to be performing well with cpu maxing at ~30%.
Fleet cpu profile & trace
The following profile and trace was collected on a local development machine with similar load.

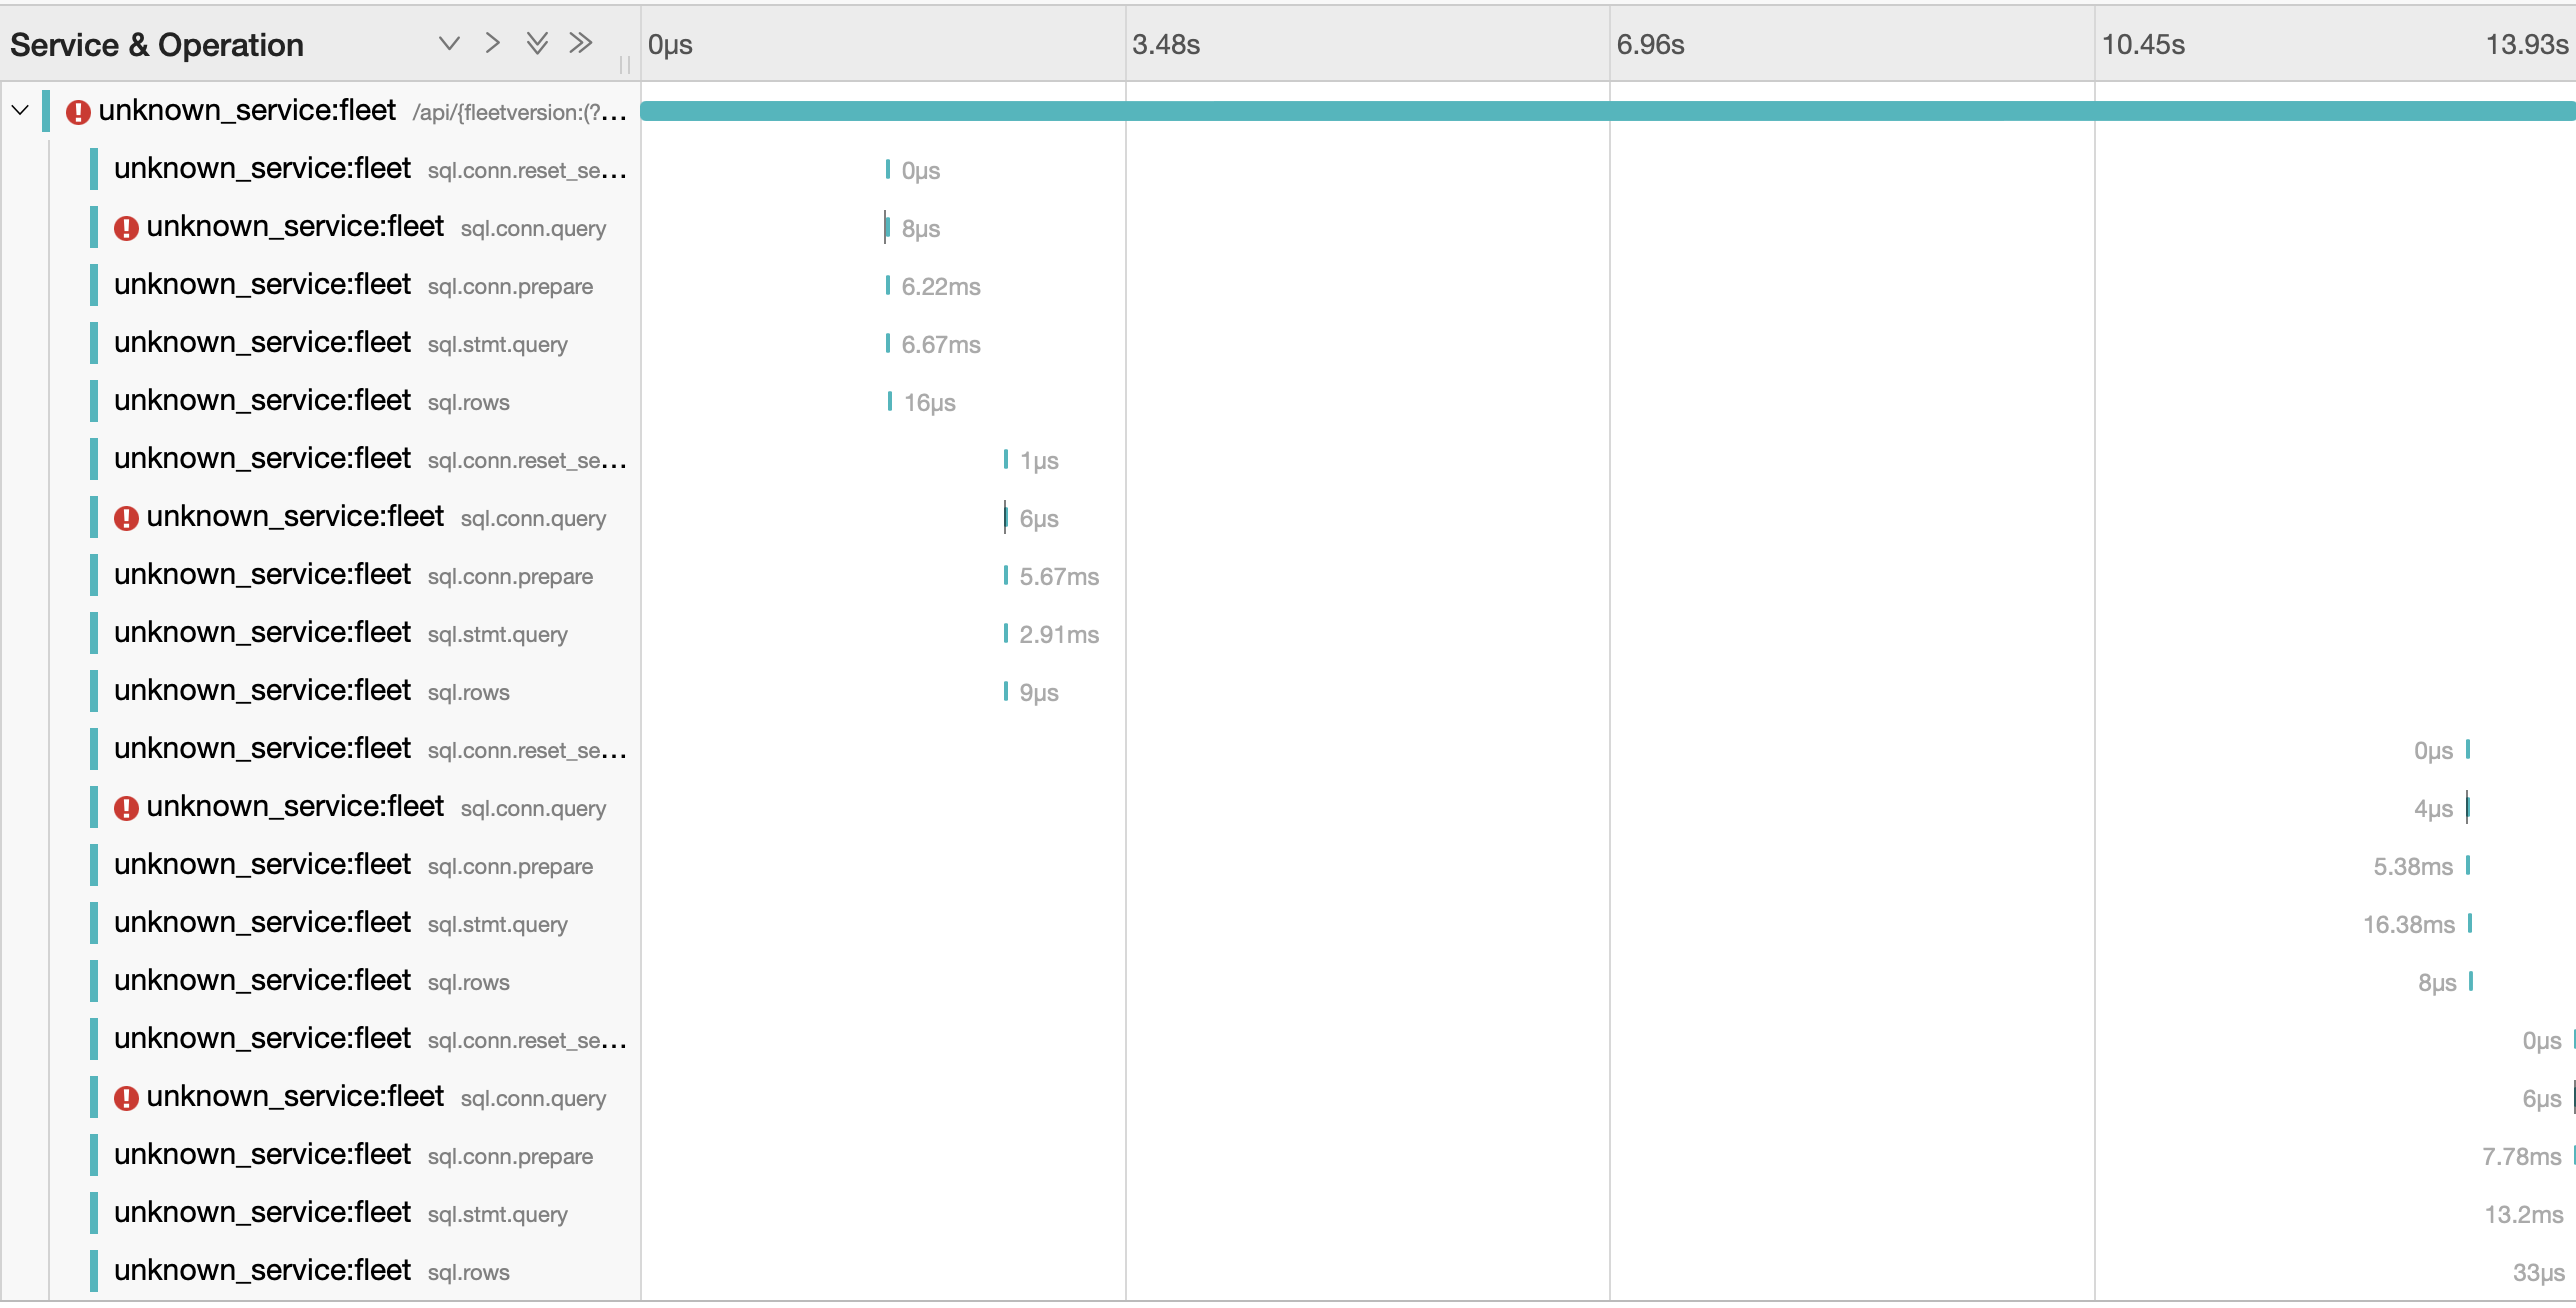
Analysis
Performance starts to degrade above 500 requests/second to the /hosts/:id endpoint. The limiting factor is likely fleet and not the database.
- Large gaps in the trace above, not spent waiting for calls to the database
- Sharp rise in cpu usage. Large amounts of cpu time spent in runtime library. May be due to garbage collection or scheduling goroutines.
Adding a separate endpoint ie /hosts/:id/policies to return only the host policies needed would likely lead to better performance. Alternatively, we could investigate further and improve the /hosts/:id endpoint.