Extensions disabled
I have configured Firefox with "firefox.profile": "default-release", which is my main profile. I have a bunch of extensions. When I start a debugging session from vscode, all those extensions disappear from the UI bar, although they seem enabled when I go to configuration:
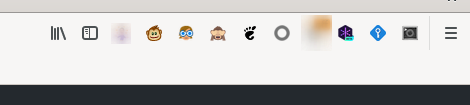
Main firefox:
Copied profile:
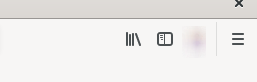
And when I go to extensions on that profile, they seem enabled, but they are not. If I toggle them twice, they start appearing:
I use those extensions for easier debugging, so I'd appreciate it a lot if they can be kept when copying the profile.
Note: when the copied Firefox appears, those extension icons appear there for a blink. Then they disappear.
@Yajo Thanks for creating this issue. I also experience this problem. I also need some extensions during debugging.
You need to explicitly set the profile you want Firefox to use while debugging. Otherwise I think it creates an empty profile each time.
- Go to
about:profiles(type this in URL bar) in Firefox and there you'll see "This is the profile in use and it cannot be deleted". - Look at the end of the path to that profile. There you'll see something like
86jtnway.default-nightly. Remember the part after the dot (default-nightly). - Add
profile: [value after the dot]to your launch config (profile: 'default-nightly'). You may not have a default-nighlty profile, you'll have onlydefaultif you use the stable Firefox etc. You can also create a new profile inabout:profilesthat you use in debugging (which is what I did and called it 'vscode-debug').
Though keep in mind if you use the same profile for browsing while having a debugging session open you'll have problems with freezing (if you try going to a page in your browsing window it'll be loading forever).
I recommend creating a fresh profile (eg. vscode-debug), installing only the extensions you need in it, then running debugging on that profile. If you do that, you'll also need to run your debug firefox with -no-remote to force it to start a new Firefox instance, rather than connect to your browsing one.
See my launch config below. It works but it has some options that I've forgotten what they do at this point :P
From github readme:
- profileDir, profile: You can specify a Firefox profile directory or the name of a profile created with the Firefox profile manager. The extension will create a copy of this profile in the system's temporary directory and modify the settings in this copy to allow remote debugging. You can also override these properties in your settings (see below). The default profile names used by Firefox are default, dev-edition-default and default-nightly for the stable, developer and nightly editions, respectively.
Here's my launch configuration:
      {
        "name": "Firefox attach (local!)",
        "type": "firefox",
        "firefoxExecutable": "C:\\Program Files\\Firefox Nightly\\firefox.exe",
        //no-remote allows running two different profiles at the same time
        //without this, firefox will freeze if you have a debug instance and personal web browsing instance open
        "firefoxArgs": ["-no-remote"],
        "profile": "vscode-debug",
        //without this, the extensions in the above profile disappear (vue devtools etc.) even though I explicitly installed them and want to keep them
        "keepProfileChanges": true,
        "request": "launch",
        "reAttach": true,
        "url": "https://localhost:4402",
        "webRoot": "${workspaceFolder}"
      },
@3nuc Thanks a lot for your comment! The "keepProfileChanges": True argument indeed solves the problem of the extensions not appearing. The ["no-remote"] firefox argument, however, breaks the automatic URL forwarding. As a result, I, therefore, use the following configuration file for debugging react:
{
      "name": "Launch firefox (localhost)",
      "type": "firefox",
      "firefoxExecutable": "/opt/firefox_dev/firefox",
      "profile": "vscode-debug",
      "keepProfileChanges": true,
      "request": "launch",
      "reAttach": true,
      "url": "http://localhost:3000",
      "pathMappings": [
        {
          "url": "webpack:///src",
          "path": "${workspaceFolder}/src"
        }
      ]
    },
@Yajo maybe you can check if @3nuc solution also solves your problem?
Chrome debugger equivalent
{
      "type": "pwa-chrome",
      "request": "launch",
      "name": "Launch Chrome against localhost",
      "url": "http://localhost:3000",
      "webRoot": "${workspaceFolder}",
      "userDataDir": "${workspaceFolder}/.vscode/vscode-chrome-debug-userdatadir"
    },