profiler
 profiler copied to clipboard
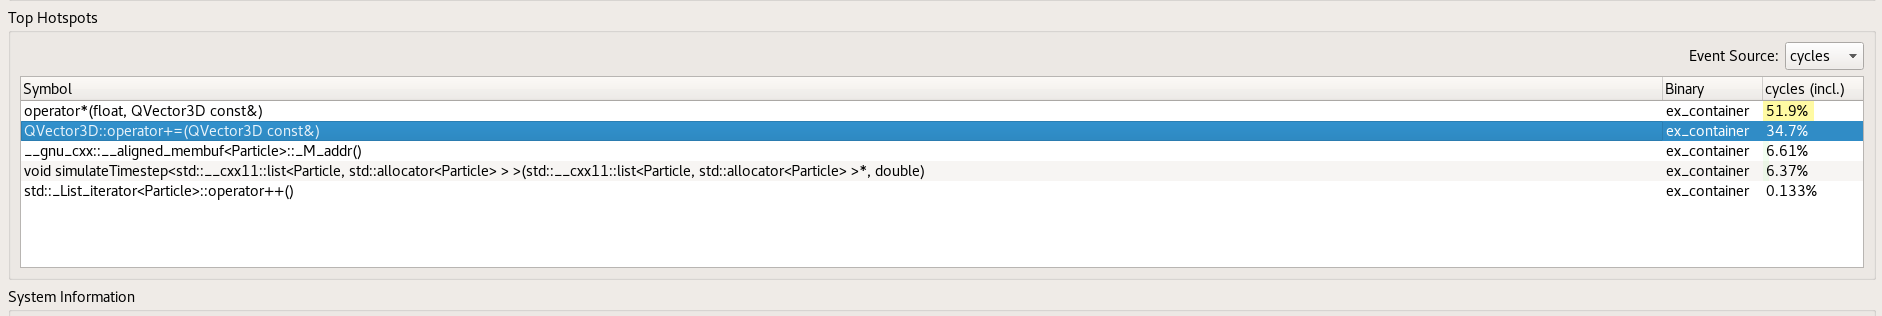
Provide a "summary" view with top hotspots
I'm not sure this is useful with what we already have. But tell me what you think @mstange @gregtatum @zoepage .
@julienw would this similar to heaviest stack trace? https://help.apple.com/instruments/mac/current/#/devd53abb62
I'm not sure what "heaviest stack trace" means.
I think this is a subset of https://github.com/firefox-devtools/profiler/issues/15, especially the first point of what Mike Conley described there.
I tried to implement this in https://github.com/firefox-devtools/profiler/pull/1538, except in this experiment I used the self time instead of the inclusive time to sort functions, but we want the inclusive time here.
The hotspot above keeps only a part of the list, kind of what I did in https://github.com/firefox-devtools/profiler/pull/1534 (360 view, aka summary view).
I continued some discussion in #15 to narrow down the initial feature request.