profiler
 profiler copied to clipboard
Published
20 hours ago •
 firefox-devtools
We should add a visual indicator in the call tree at the edge of libraries
See the following capture:
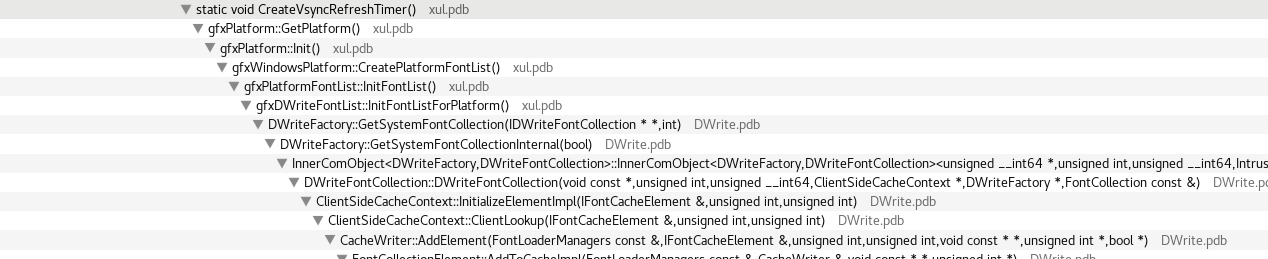
In a stack we have nodes from both xul.pdb and DWrite.pdb. At other places we have other libraries like user32.pdb or ExplorerFrame.pdb.
Ideas:
- change the background color for different libraries
- change the color for the lib name text
- add an horizontal colored line at the node edge
┆Issue is synchronized with this Jira Task