Self percentage is missing in the call tree view
In the Call Tree view the percentage for the self time is missing.
┆Issue is synchronized with this Jira Task
This has been on purpose so far. But maybe this is something that coulmd be useful. What do you think @mstange ?
Also a percentage of the running time may be useful too. For example in this case we'd have 35.5% (4807.4 / 13559.5).
My fear is that it would clutter the view. Maybe we could have a toggle to switch from absolute value to percentage... But I don't know...
We could surface this type of information in the sidebar. I'm skeptical about adding another column to the already data-dense call tree.
In order to support this as a column I think we would need a context menu to toggle on/off various columns. I'm not sure it's worth the complexity though.
@copy could you talk more about your use case for having it in the call tree?
The rationale for the current set of columns is that "that's what Instruments does". I don't object to adding a self time column, but I've personally never felt like I needed it.
@copy could you talk more about your use case for having it in the call tree?
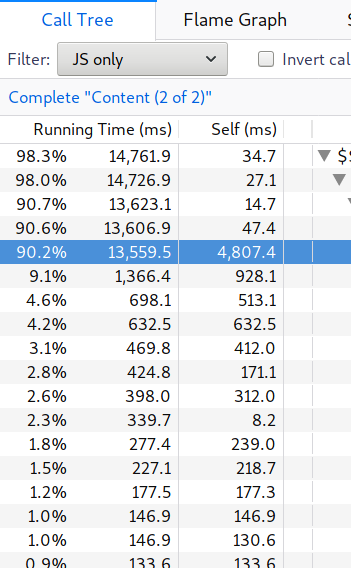
In the above screenshot, it isn't obvious (from a quick glance) that a lot of time is spent in the function in the highlighted row itself (about 32%). One needs to consider the value in the self column relative to the total running time, which requires some mental math.
Another, much weaker argument is that it's what both Firefox and Chromium devtools show.
I was thinking about this issue for the past 2 days. I feel link having both % values is a good thing to have, but I agree with the issues of having enough space.
What do you think about showing the percentage as a coloured background? We could apply this to both % values. It would also decrease the amount of reading.
What do you think about showing the percentage as a coloured background?
I'm not sure of this, especially because of the accessibility :(
In the above screenshot, it isn't obvious (from a quick glance) that a lot of time is spent in the function in the highlighted row itself (about 32%). One needs to consider the value in the self column relative to the total running time, which requires some mental math.
I gave some more thoughts: @copy, isn't it what the inverted tree would help to show you? I believe the inverted tree is showing the list of functions ordered by self time, and this make it possible to directly point at the function responsible for your performance issue.
Simply adding a percentage column for "self time" wouldn't bring much help because you'd still have to filter the tree with your eyes, that's why I believe the inverted tree is a much better tool for what you're looking for.
Note that when the tree is inverted, the "running time" column is now the same as the "self time" column for all top-level functions, and so the displayed percentage is what you want here.
What do you think ?
I gave some more thoughts: @copy, isn't it what the inverted tree would help to show you?
Indeed, it would, to a certain degree. My workflow doesn't usually include looking at the inverted tree view, though. In the inverted view I can only see the self time, while in the normal view I can see both self time and time spent in descendants. I tend to look for a function with a high time spent in descendants in the normal view, focus on that function and try to understand both times of its children.
That said, I do appreciate the focus on keeping the interface uncluttered, and I believe perf.html is better than the common browser devtools in this aspect.
My workflow doesn't usually include looking at the inverted tree view, though.
I suggest you use it more often then, as this is a very effective tool. Sometimes it yields nothing (heh) but often it points towards the right issue very quickly.
But I understand what you mean and I also use a similar workflow: going down the children, keeping the right arrow pressed, only stopping where the "running time" suddenly drops: either because of a branching or a bigger self time.
@julienw what do you mean by
I'm not sure of this, especially because of the accessibility :(
I'm not sure of this, especially because of the accessibility :(
Because conveying data using colors only isn't so good for accessibility (think people with some color blindness). It doesn't mean it's impossible to do, I'm not an expert in this field :)
Seeing other tools, I wonder if we couldn't use just the percentages instead of the absolute values. Especially that absolute values may lie if we miss samples, but percentages likely lie a lot less. What do you think @mstange @gregtatum @zoepage ?
@julienw
I wonder if we couldn't use just the percentages instead of the absolute values.
Just providing the percentages might get confusing at some point as 3% of 1KB is different as 3% of 500KB. Would we have a total size indicator somewhere?
If not, another idea could be to have a way to toggle % and absolute size in the view.
Would we have a total size indicator somewhere?
This is the range at the top. But I agree this is quite far from the table, so difficult to relate. Maybe it should be repeated closer to the call tree.
I don't like toggles so much, this would feel like we failed at providing the right choice ;)
The more I think about this, the more I want different percentages for different types of analysis.
I was looking at a requestAnimationFrame loop, and I started filtering and transforming the information. I finally got it down to some "interesting bits", but then I wanted to know the "percentage of time in the range selection" and I couldn't get at it. I think there could be quite a few of these percentage type of values that could subtly different meanings depending on the analysis. Perhaps the sidebar would be a mitigation, and at least provide some of this information.
I'm not opposed to adding some configuration to the table headers, as long as most are off by default, but it would require more complexity in the implementation I think.
the "percentage of time in the range selection"
You're refering to the "range selection" as in "uncommited range selection", right ?