Handle unsymbolicated JIT frames
Edit: This issue is now tracking work in https://bugzilla.mozilla.org/show_bug.cgi?id=1426124
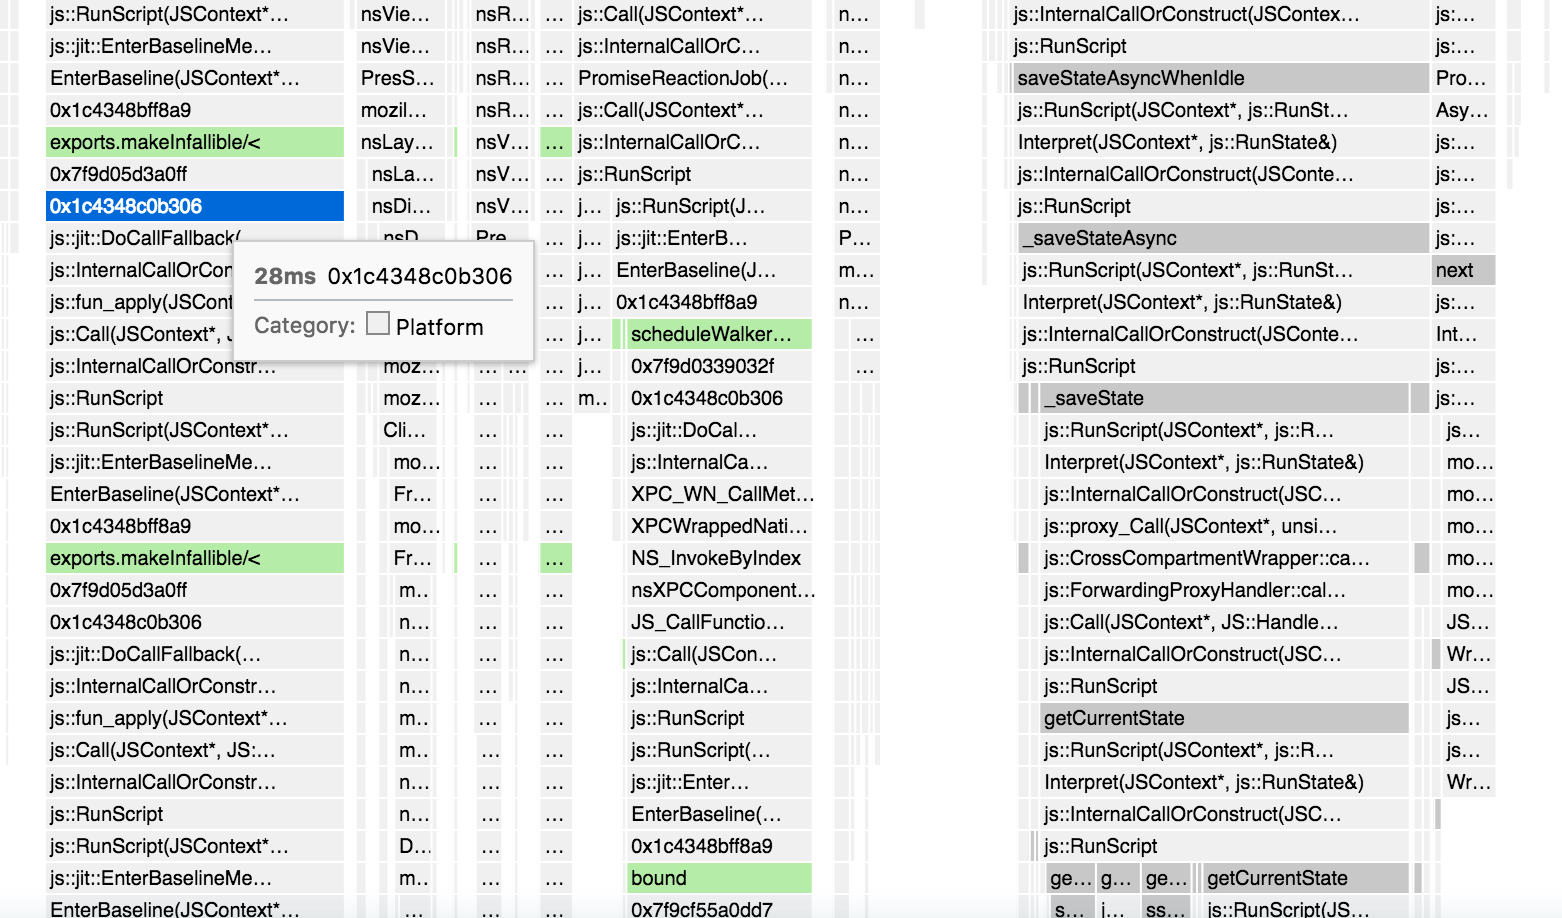
JIT frames are usually followed by a few frames of unsymbolicated memory. This is confusing our users as can be seen by https://bugzilla.mozilla.org/show_bug.cgi?id=1397718. There is there any value in keeping these frames here? I see two clear ways to deal with them.
Option 1: Process them out
I'm not sure the frames give us any real useful information in of themselves. I would be in favor of stripping them out from the profiles in a processing step. We can correctly identify by merging any stacks directly following a JS JIT stack.
Option 2: Label them as JIT frames
If there is something useful about keeping them around then we should at least add some kind of knowledge about them to the processed profile format, then display them as "(generated JIT code)" or something like that. I don't think there is any utility in showing the raw memory addresses.
┆Issue is synchronized with this Jira Task
I can see they are both before and after the JS filename. I think we need to understand what's really behind: if this is part of the JS function execution then it should be merged into it; if it's part of the JS engine mechanics, then it should be merged in either EnterBaseline or DoCallFallback.
Note that if that appear to be any complex to do, any of the two solutions look good to me. And if that's too hard, a simple note in a visible documentation could be enough. Just saying, if you have more important things to work on.
The most important thing to me, was to get the confirmation it wasn't hiding useful information. From now on, every time I'm going to see an unresolved address, I'll check if it has an associated .so or not.
@ochameau I think it's something I think we should handle correctly, it's something that mysterious that shouldn't have to be.
To @julienw's question, is it correct to say that those are addresses of JIT frames that got de-optimized (or otherwise invalidated)?
These are frames containing actual JIT code. The JS engine maps some memory, JITs instructions to it, then marks it as executable, and then EnterBaseline / other places jump to it to run that code. This is a giant hassle for other tools that walk stacks as well, FYI.
The JS engine does have support for informing debuggers about these frames, so it's possible we could use those same hooks to put info into profiles to detect JIT frames.
On 64-bit only the JS engine calls these APIs to register a JIT code region: https://dxr.mozilla.org/mozilla-central/rev/19b32a138d08f73961df878a29de6f0aad441683/mozglue/misc/StackWalk.cpp#137
We could feed that info into the profiler and store it in profiles, and you could annotate frames accordingly. I think the only reason it's not done on 32-bit is because it's only currently used for stack unwinding, and on 32-bit we can just unwind with frame pointers through JIT frames, whereas on 64-bit we need extra help.
@luser Would this be worth doing? In the perf.html client we could do a quick fix to hide those frames.
I think it'd be useful info, and I don't think it would be a lot of work to fix. I'll file a bug.
Filed: https://bugzilla.mozilla.org/show_bug.cgi?id=1407662 . I think this information would be useful in crash reports as well!
Found https://github.com/devtools-html/perf.html/pull/292 where we just filter out these frames in C++-only mode.
Suggestion from @upsuper in #713: merge all JIT addresses nodes with the same parent into one "generated code" node. (basically "option 2" from the initial description, with a "sibling merge" operation).
I'm not sure if it's the exact same issue, but I had a specific fix that might help the situation here: https://bugzilla.mozilla.org/show_bug.cgi?id=1426124
I think Luke's proposed fix is the correct one that will solve this. I notice that @julienw put this in our backlog, so I'm going to modify this from a discussion issue, into a tracking one that needs a gecko patch.