Add ability to create custom markers/bookmarks in the header timeline
Requested by Mike Conley: "I'd love it if I could add my own markers to a profile while I'm analyzing it - like a bookmark, to know where things seem to be occurring. I usually need something like that if I'm trying to zoom on the region that I care about, and have only found one end of it so far."
More info: "Yep, timeline would be fine, certainly. So long as I could map it to the samples in the threads up above, that's all I care about. :)"
- [ ] write about the user flow could work
- [ ] get feedback
- [ ] create initial wireframe
┆Issue is synchronized with this Jira Task
Still a bit confused about this one. It seems like it may be partially related to #215: custom colored nodes. E.g. one should be able to bookmark either a point in the header timeline or in the callstack by right-clicking and selecting "Add marker" - we can automatically assign a color based on the Photon colors (e.g. grid colors).
We could also auto-assign labels, e.g. "Main thread 5.2 ms," assuming this distinguishes between threads. If this isn't distinguishing between threads, but rather just marking an entire slice of time, maybe breakpoint-style bookmarking (clicking in the seconds row to turn a bookmark on or off) would be possible.
Either way there would need to be an easy way to delete markers, and possibly a list of all markers in the Summary tab.
Still a bit confused about this one. It seems like it may be partially related to #215: custom colored nodes.
#215 is about annotating the call tree. I believe what Mike Conley is referring to is annotating the time ranges for when things are happening.
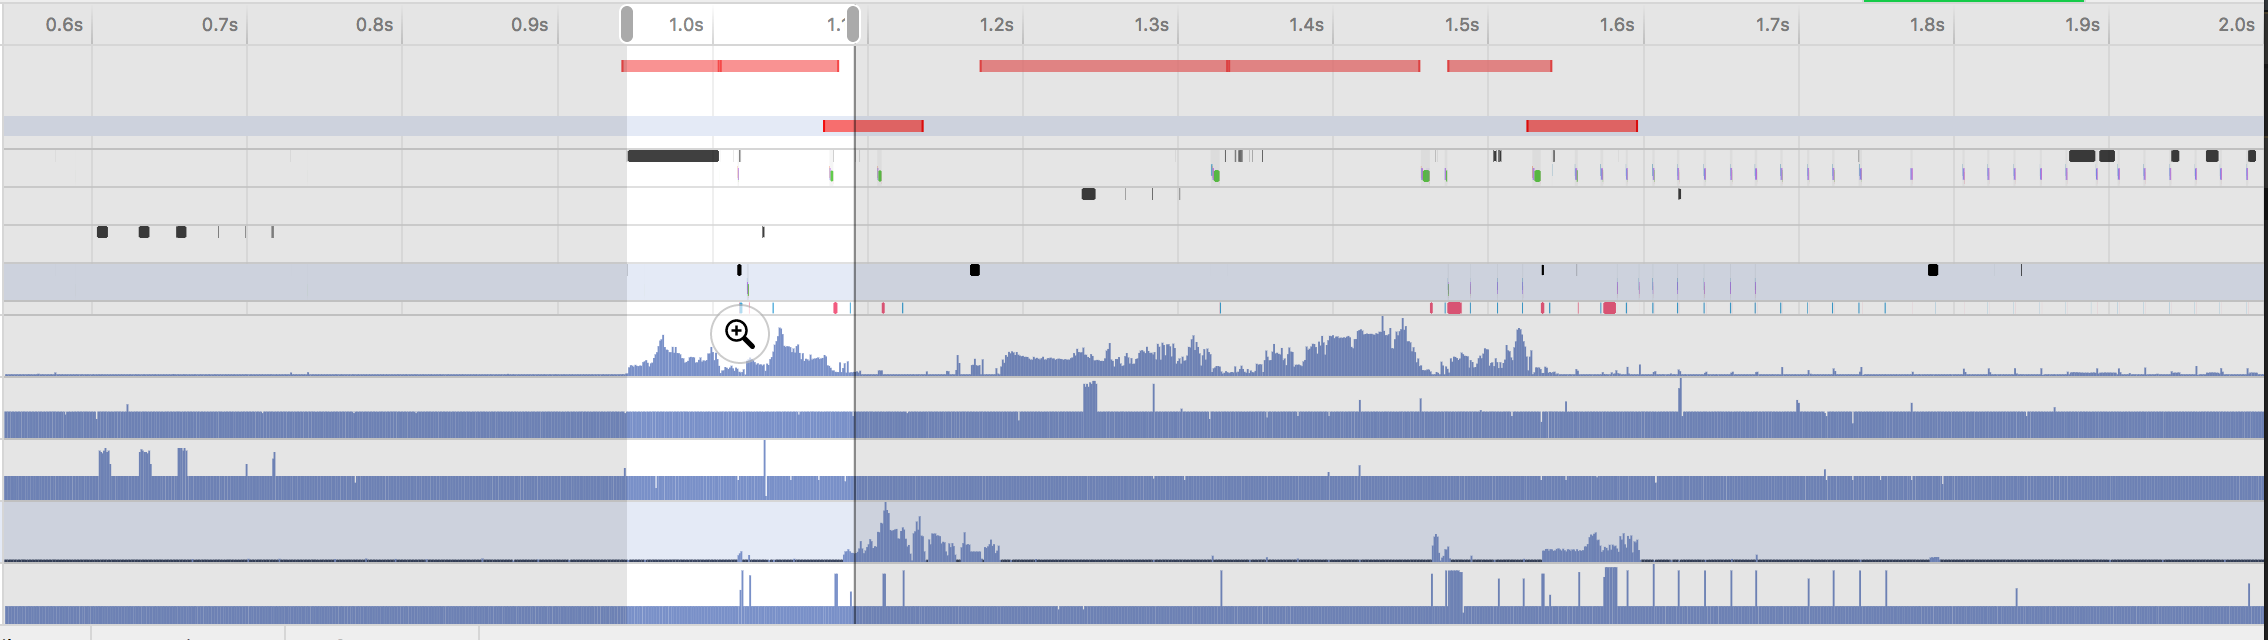
For me reporting a bug, what I would like to do is go into a profile, explore it, then annotate it with my own marker information. So my user story would be I would record a profile of something I'm interested. I would then create a range selection. Then I would create a marker for that selection.
For instance here I could annotate this first section as "Devtools opening"
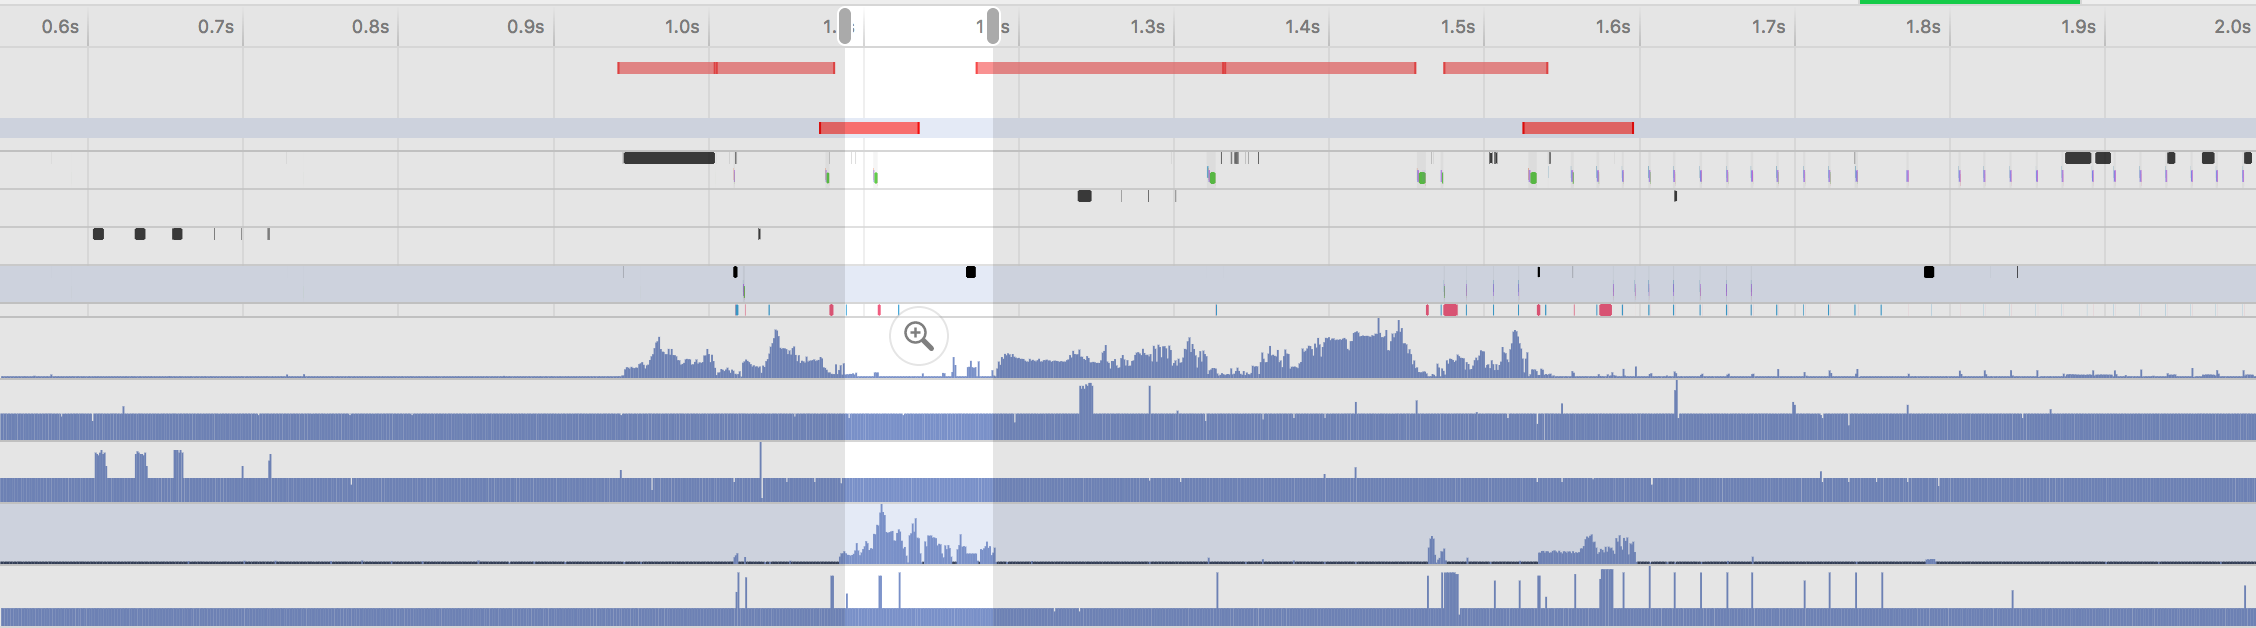
Then I would annotate this section as "Devtools initializing on page"
Then "Devtools loading inspector"
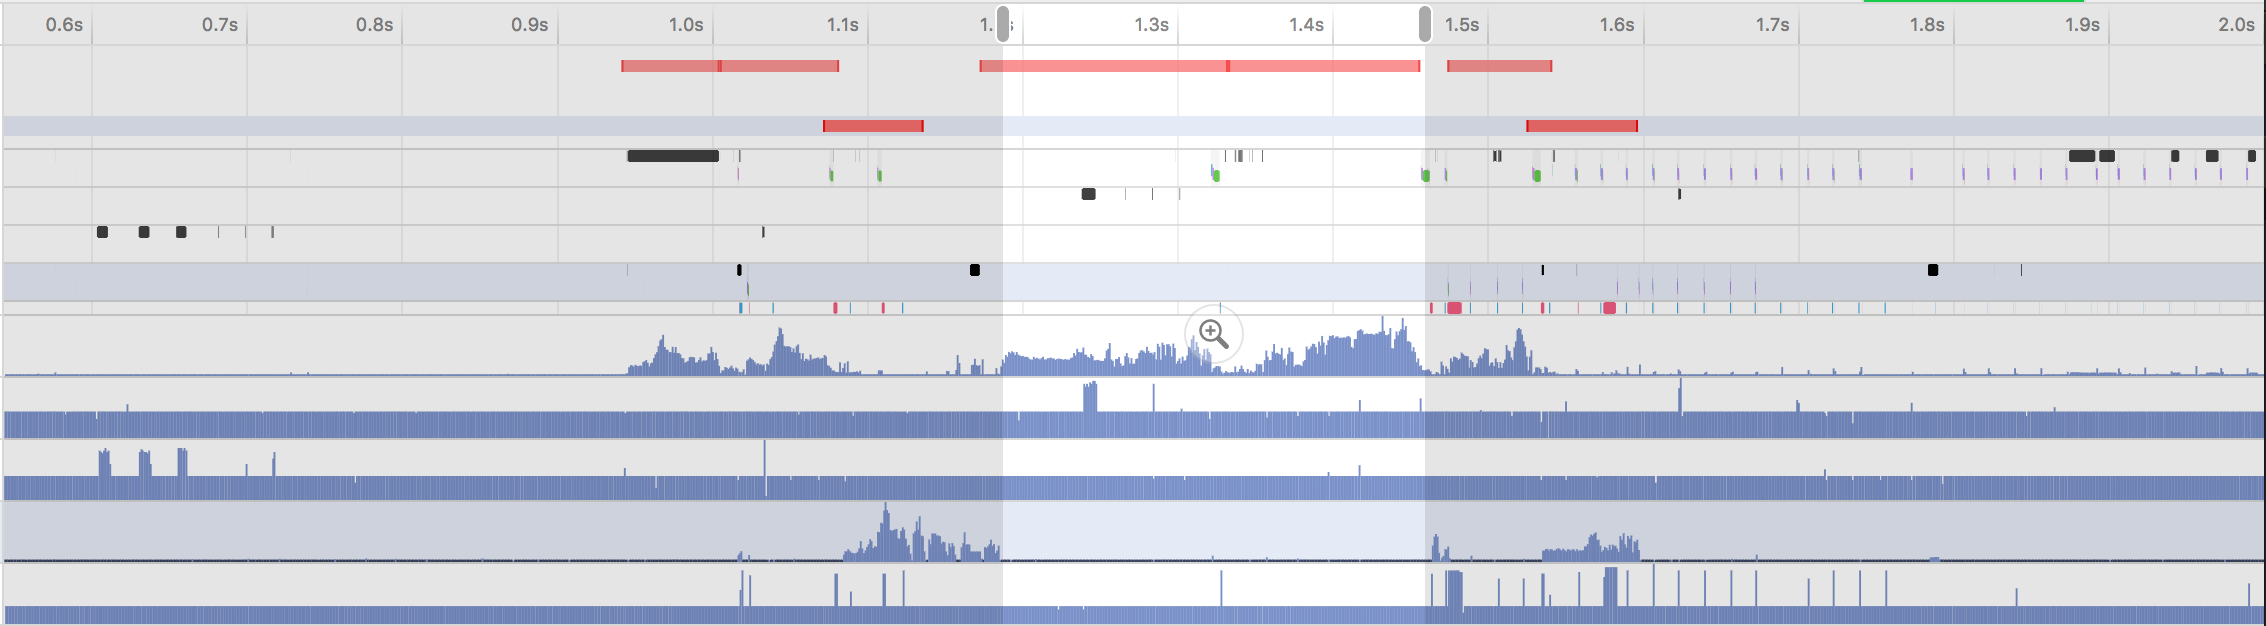
It would also be nice to associate those per-thread, as those actions are happening in different threads as can be seen by their Thread Stack Graphs.
This is underspecified and hasn't been requested recently, but seems a valid request. Removing the discussion label for now but keeping in the backlog.
Adding this conversation
https://twitter.com/drewml/status/1237078721162510344