profiler
 profiler copied to clipboard
Support go's pprof format
Here are examples of the cpu profile and heap profile generated with -cpuprofile and -memprofile options:
cpu.prof.gz
mem.prof.gz
I generated these from the github cli repository running this command line:
go test -cpuprofile cpu.prof -memprofile mem.prof github.com/cli/cli/v2/api
It may be better to use a more complex test.
It may be better to support the callgrind format or the traces format, that can be output from pprof (go tool pprof -callgrind <filename> or go tool pprof -traces <filename>).
Here are examples for files generated using these formats:
callgrind formart for the cpu profile: profile001.callgraph.out.gz
callgrind format for the memory profile: profile003.callgraph.out.gz
traces format for the cpu profile: cpu.prof.traces.gz
traces format for the memory profile: mem.prof.traces.gz
┆Issue is synchronized with this Jira Task
callgrind's format is described in https://valgrind.org/docs/manual/cl-format.html It sounds like a good idea to support this format because other tools might use it too.
Perhaps could draw inspiration from https://github.com/jlfwong/speedscope/pull/165 which achieved a very similar task
I've written a PoC converter for pprof -> the "post-processed gecko" format
Here is a test input profile:
And the resulting gecko profile (not all structures are fully initialized, but doesn't seem to cause a crash):
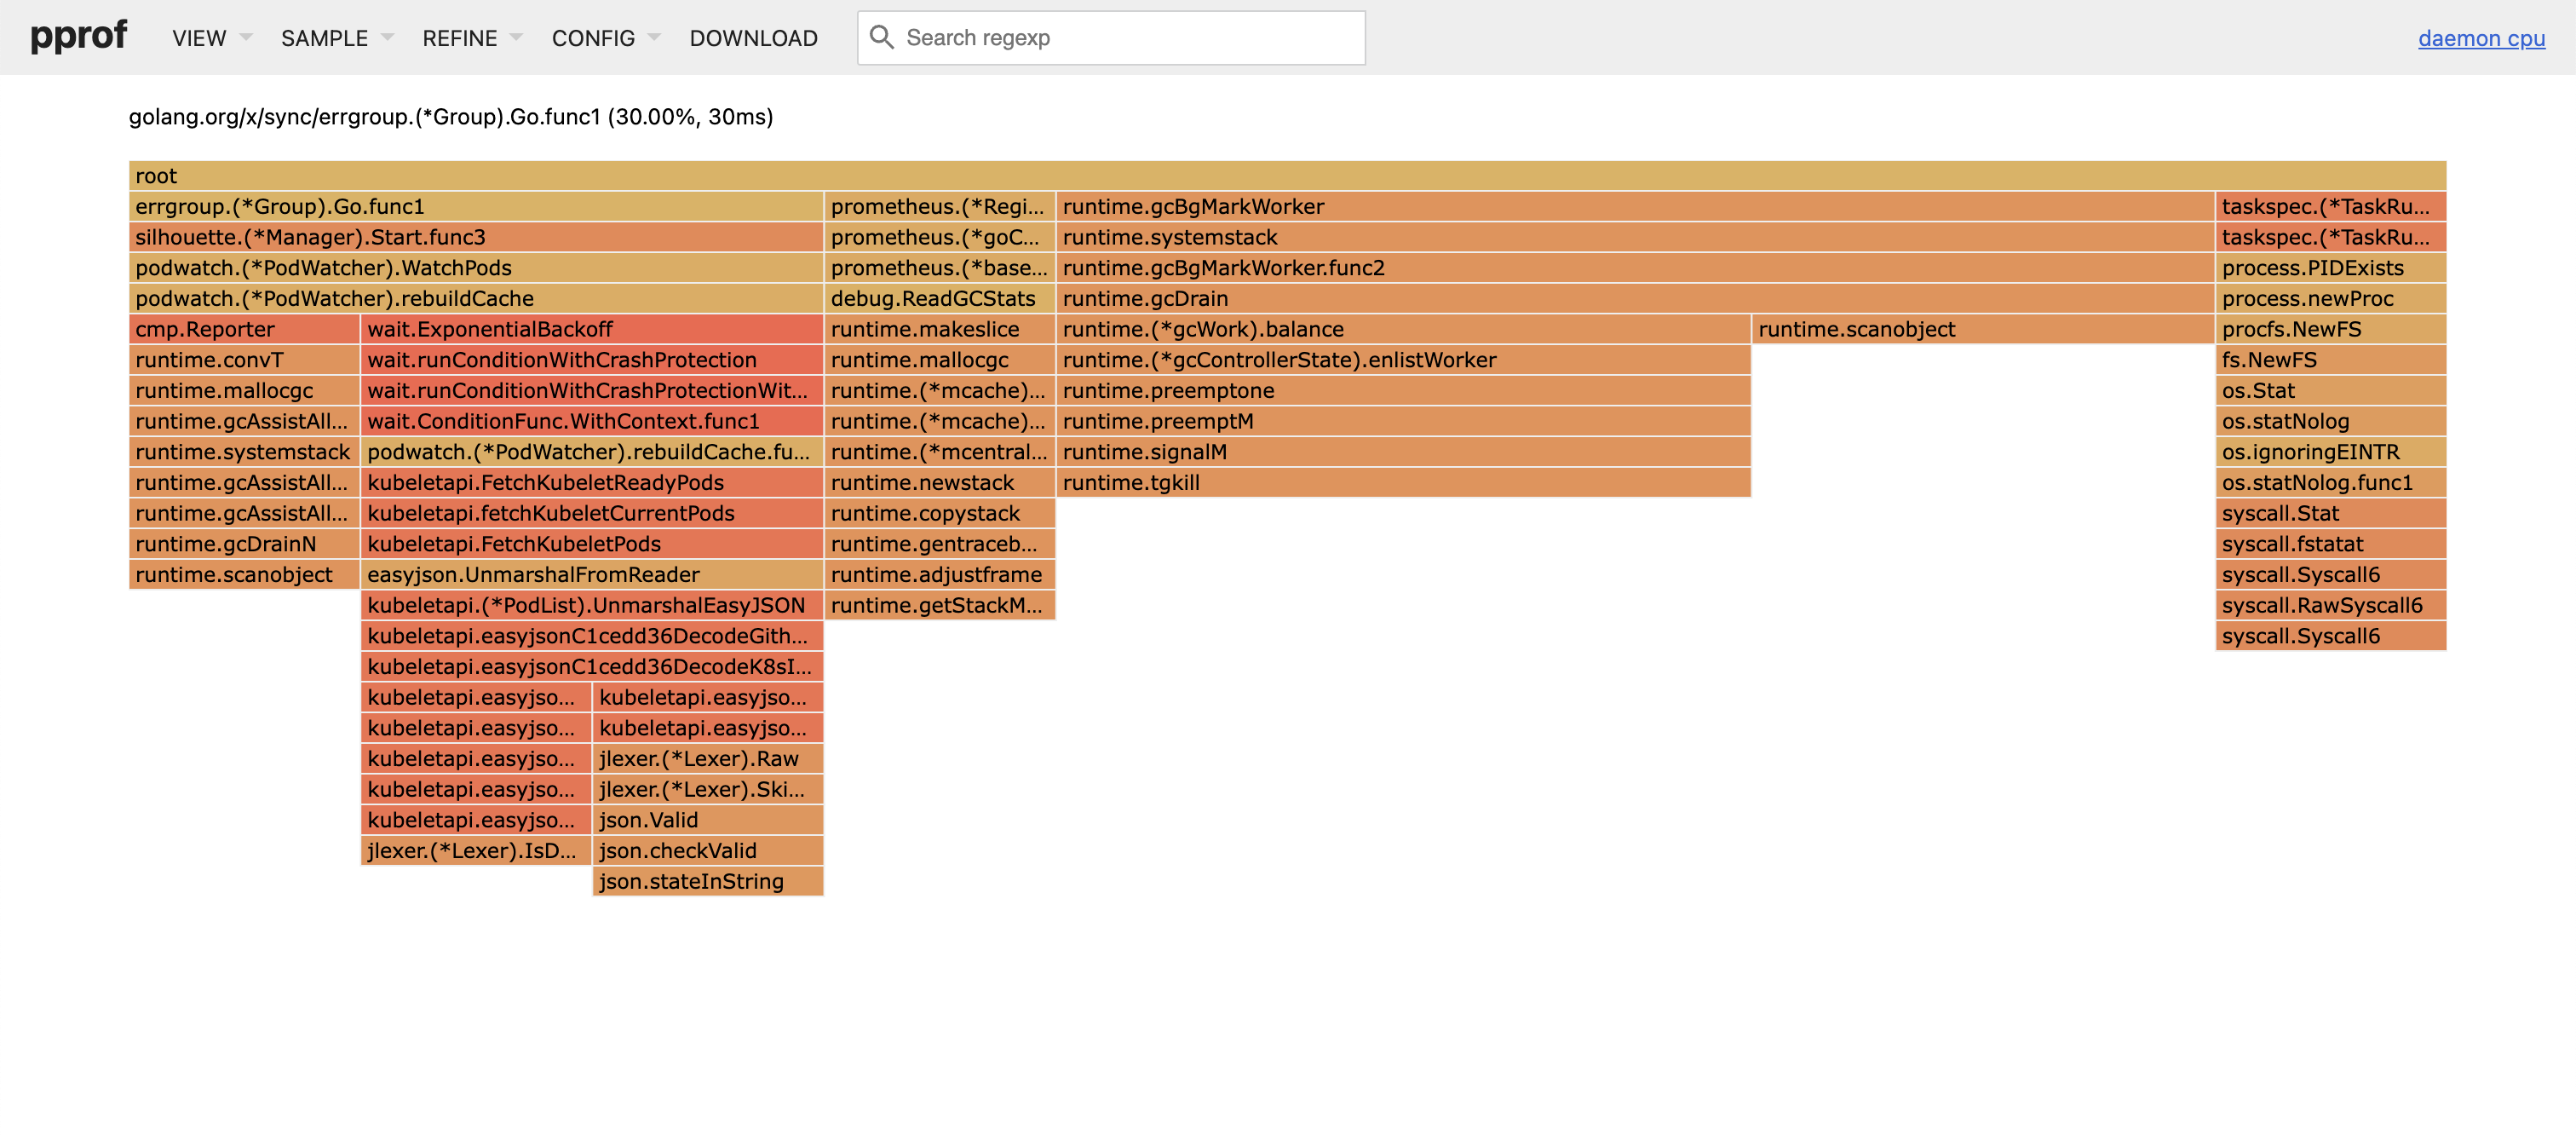
The original pprof, as viewed in speedscope / go's own go tool pprof http server:
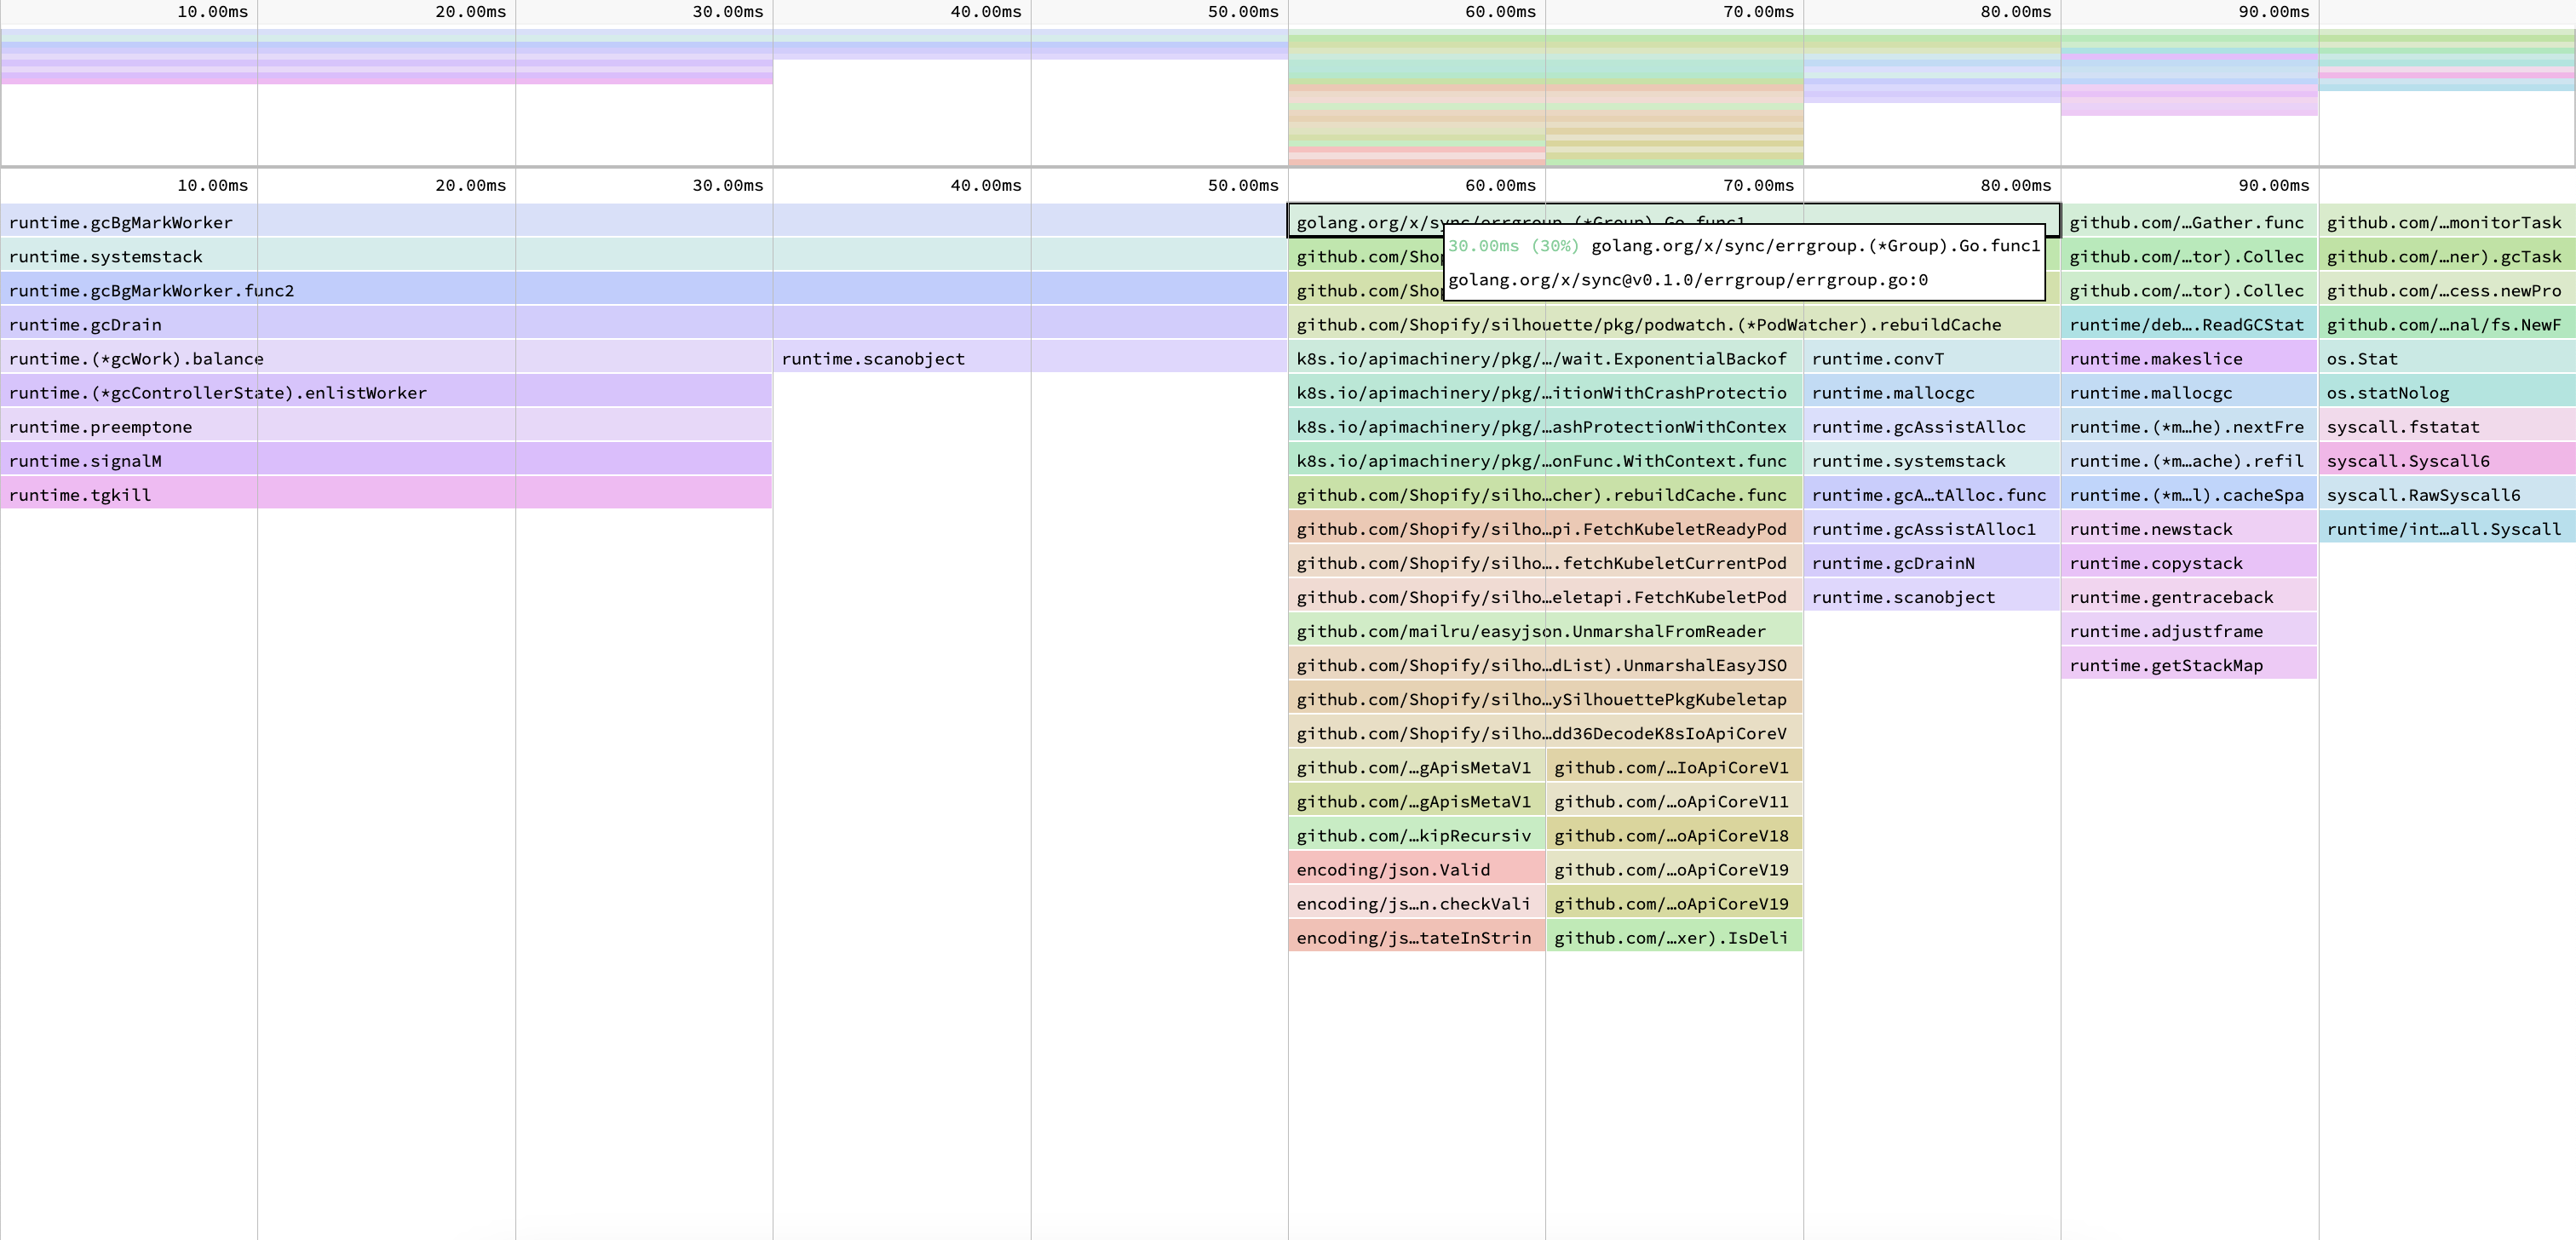
In Speedscope:
And the converted JSON in firefox profiler:
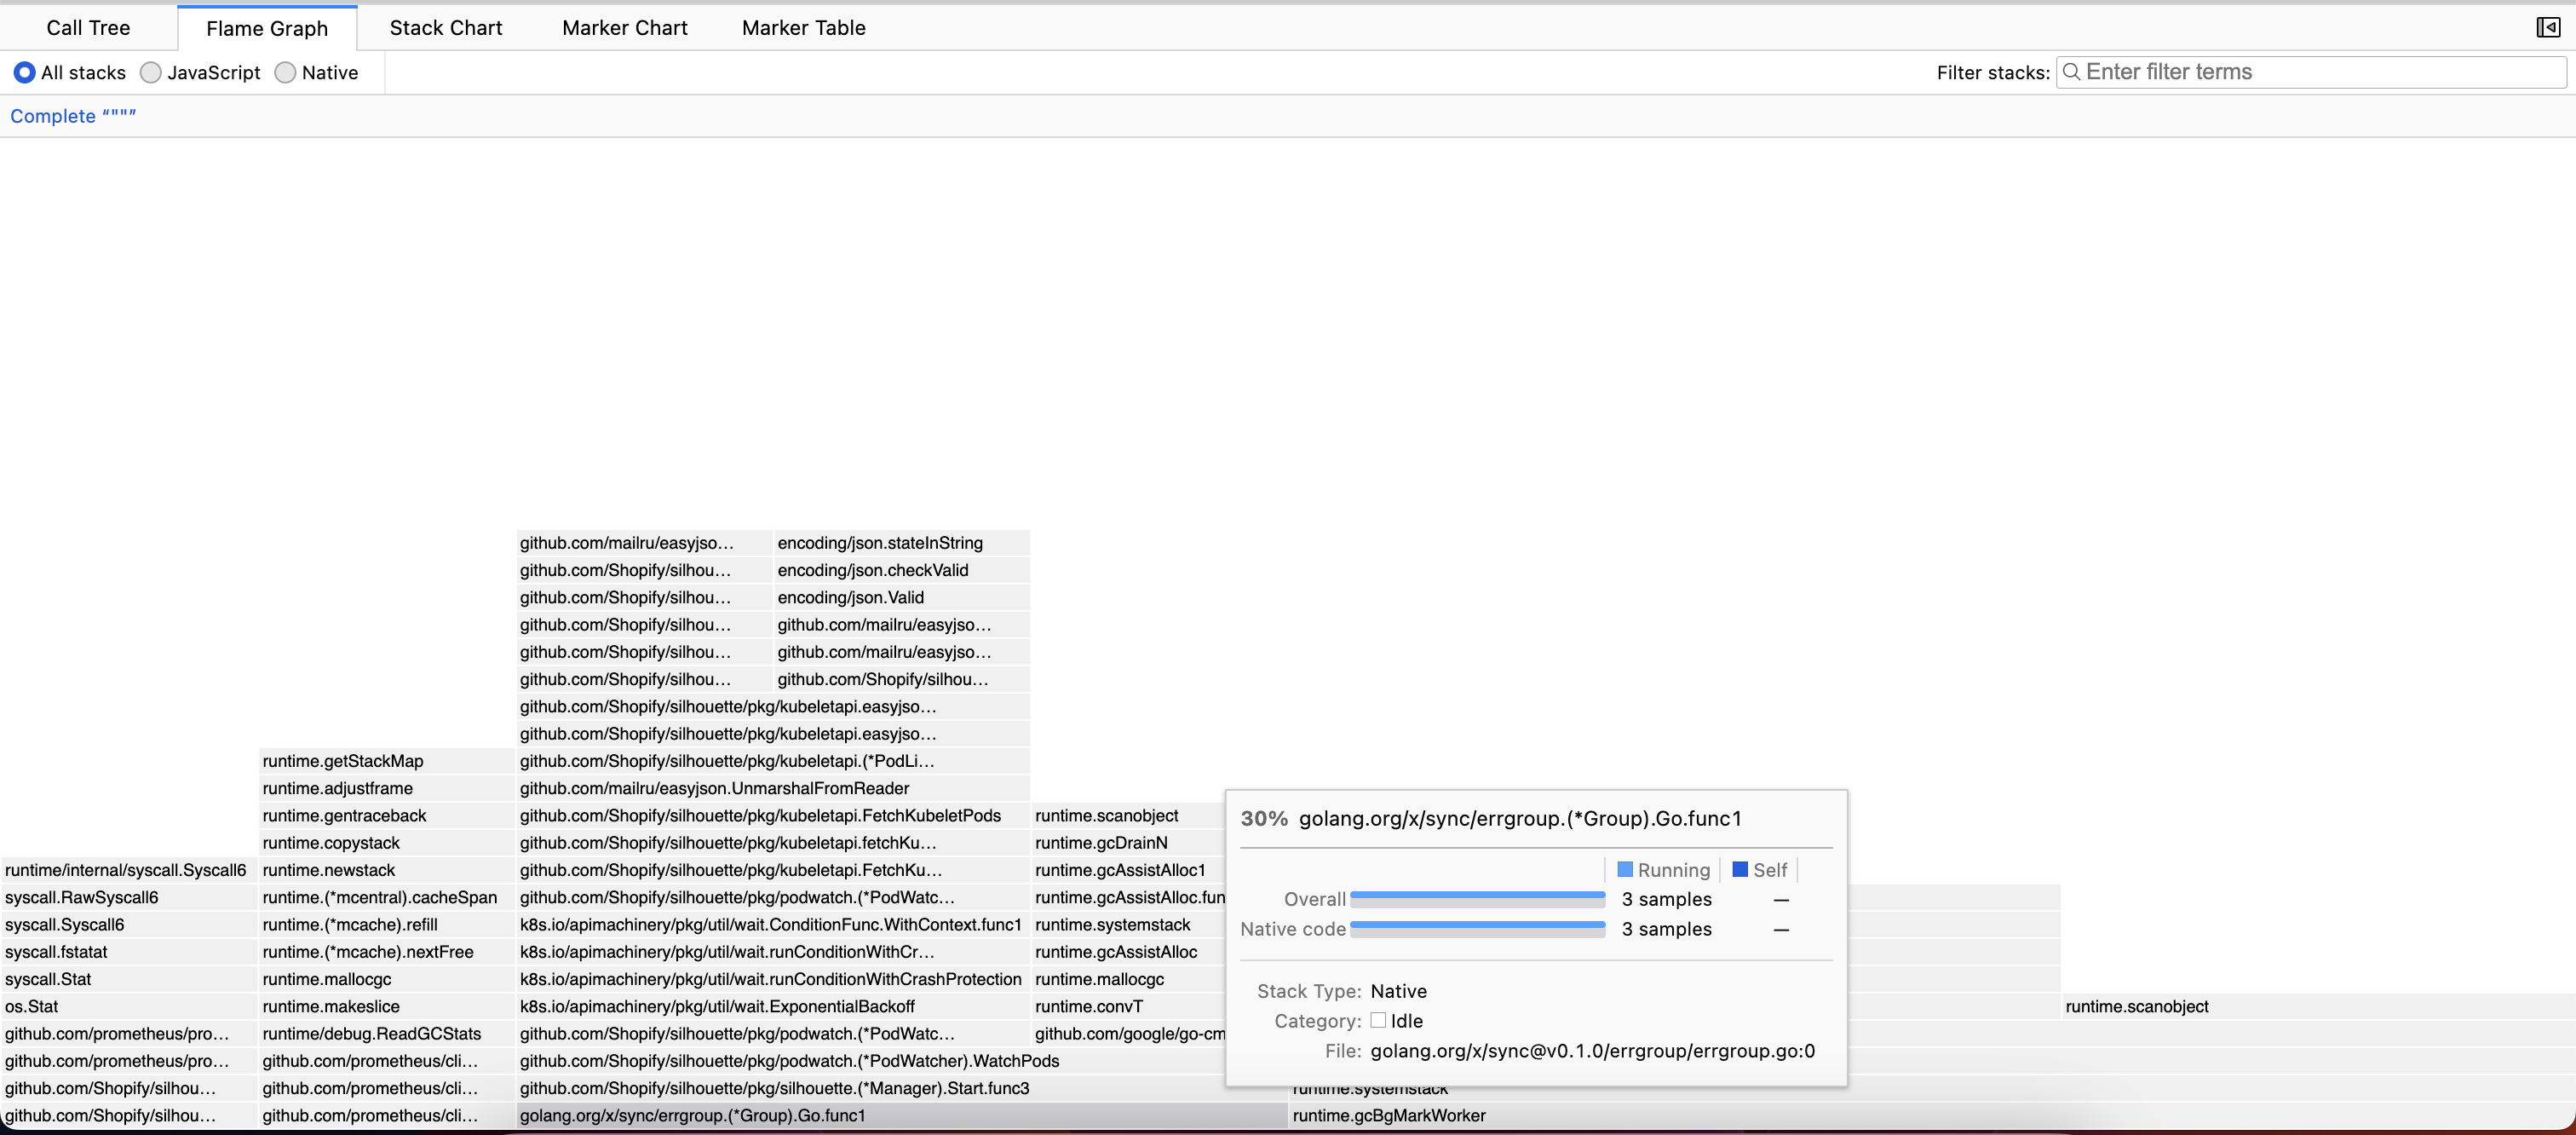
In these examples, you can see that the first two show 30ms in the hovered frame, and in the Gecko it shows up as "3 samples", but it is missed that the sample period is 10ms, so there are still some issues. The biggest of which being that I am very out of practice on javascript, so wrote my prototype in Golang. I'll clean up the code with the aim to share my approach nevertheless, as well as some of my learnings and caveats, in case it would help inform an importer for this issue.
The mapping of samples is easy enough, a pprof "Location" seems to map well to a Gecko "Frame", but I relied on mapping the sample values in pprof to gecko's "weight", but ValueType which allows for arbitrary weight values, but firefox-profiler seems to only support a few special ones, so these don't map cleanly 1:1, but can still be useful for analysis once it is understood what a "sample" means in context.
Thanks for looking at this!
Initially I was thinking about supporting the callgrind format because it might be an output format for other tools as well, so this provides more bang for the bucks. Also because it's a textual format, it should be possible to support it with a simple regexp-based parser instead of having to import protobuf into this project.
I'm eager to know your thoughts about that!
I'm eager to know your thoughts about that!
Absolutely! Here's my current thinking based on my prior experience with pprof, and weekend of hacking with gecko...
Initially I was thinking about supporting the callgrind format because it might be an output format for other tools as well, so this provides more bang for the bucks. Also because it's a textual format, it should be possible to support it with a simple regexp-based parser .
I'm not as familiar with these formats, I looked at a sample callgrind and it does indeed seem they would be easier to parse, and for them avoid dealing with protobufs. Like you say it is probably good "Bang for the buck".
having to import protobuf into this project
For the pprof protobuf format, I've worked with it much more and can speak to it more thoroughly. It looks like there are a couple of projects that exist to help do this in javascript, but I'm not familiar with either of them:
- https://github.com/protobufjs/protobuf.js/
- I think this is what speedscope used, to generate typescript / javascript code to decode the profile protobuf format. One drawback is it looks like you do have to include their library, in addition to the generated file
- https://github.com/protocolbuffers/protobuf-javascript
- This looks like more what I was hoping for, I was surprised that
protocdoesn't have its own--js_outflag already when I checked, as it does for a number of other languages. This project seems to provide this somehow as an extension? - My hope is that, if this works for JS like it does other languages, this could be used to codegen a standalone file that could be the sole dependency for decoding the profile protobuf, but would need to verify it actually does this
- This looks like more what I was hoping for, I was surprised that
I certainly think there is merit in supporting importing the standard gzip'd protobuf for pprof profiles, as a bunch of profiling tools seem to be somewhat standardizing on pprof, and internally we use it as a good "lowest common denominator" profiling format. Eg, while JFR is better for java, and each language has its own version of this, as long as we can convert to pprof things tend to play well in our profiling ecosystem. It is flexible enough that you can store pretty much anything you can model as a "sample" in it, which is nice.
Once the protobuf can be decoded, I think actually translating it into gecko is fairly straightforward at least for the general case - I was surprised I was able to a proof of concept within a weekend. The trickier bit I think will be stuff like as I mentioned above, dealing with the more flexible "ValueType" vs gecko's WeightType, and accounting for the fact that samples may not be time-driven.
The nice flipside of using a code generated library to help decode it is that there is no regex parsing really needed, you get structured data which is quite easy to work with. All I needed to do for my converter was iterate through samples, and for each sample, iterate through the frames, and end up with the processed profile after doing just this single pass, maintaining a few tables to help with the conversion. It is easy to just append to arrays as you go, naturally producing gecko's processed format, so it doesn't need to converted again later.
Regardless of if there is interest in actually importing this format natively, we now at least have a workaround for viewing pprof by first processing it into the gecko JSON format. I think that the firefox profiler is a really nice UI though and the variety of projects producing pprof in the pb.gz format would benefit from it.
It would be great to have pprof support in the firefox profiler. @julienw and @dalehamel is anyone actively working on this ticket? If not, I can give it a shot.
Thanks @dalehamel for the thoughtful comments that I didn't answer before.
In these examples, you can see that the first two show 30ms in the hovered frame, and in the Gecko it shows up as "3 samples", but it is missed that the sample period is 10ms,
Indeed we decided that showing the timing information wasn't accurate and we were lying to the user. Instead we decided to show the number of samples which is more accurate, but as you mentioned needs more user education.
About the other comment:
Indeed if the pprof format is indeed output by other tools it makes sense to support it as well. Do you have pointers about those?
It would be a good idea to start thinking how to asynchronously import these importers so that webpack would generate separate bundles for them, and the user wouldn't get them if they don't need it. When they're just a few bytes it's not a big problem, but when we start importing bigger libraries then it's different.
The 2 projects you mentioned actually look like they're the 2 options for JavaScript. While protobuf.js seems much more used, as you said because protobuf-javascript generates code that doesn't need it afterwards it could be a better option -- my only concern being that it's not very well maintained as an open source project. If we want to try out protobuf It would be good to look at both of them and also profile them with some real profile data as well.
@ashishbhate is that something you'd be interested to do? In the context of this bug, we'd be happy with either the callgrind format or the protobuf-based pprof format.
@ashishbhate here is my pprof2gecko WIP, written in golang https://gist.github.com/dalehamel/661fdeefc084b27ec069ab9e07bc6ac2 with one of the javascript libraries to help you, hopefully it wouldn't be too bad to translate this approach. Either way, it might be a good starting point algorithmically. I added a comment to the gist about an optimization idea I had but haven't tried yet, which might help avoid the expensive string comparisons I'm doing for "fingerprinting" stack frames.
Indeed we decided that showing the timing information wasn't accurate and we were lying to the user. Instead we decided to show the number of samples which is more accurate, but as you mentioned needs more user education.
Thanks for the comments as well @julienw ! Your idea on how to proceed makes sense to me as well 👍
@ashishbhate is that something you'd be interested to do? In the context of this bug, we'd be happy with either the callgrind format or the protobuf-based pprof format.
I use Golang and pprof everyday, so I was more inclined towards adding support for pprof :)
@ashishbhate here is my pprof2gecko WIP, written in golang https://gist.github.com/dalehamel/661fdeefc084b27ec069ab9e07bc6ac2 with one of the javascript libraries to help you, hopefully it wouldn't be too bad to translate this approach. Either way, it might be a good starting point algorithmically. I added a comment to the gist about an optimization idea I had but haven't tried yet, which might help avoid the expensive string comparisons I'm doing for "fingerprinting" stack frames.
Thanks for the Golang code and pointers to the JS libraries. I'm not really familiar with how the Firefox Profiler works. There are a few things I don't understand (e.g. the docs seem to suggest targeting the "Processed profile format" instead of the "Gecko profile format"), but I'm sure I'll get there once I dig a little deeper :)
@ashishbhate is that something you'd be interested to do? In the context of this bug, we'd be happy with either the callgrind format or the protobuf-based pprof format.
I use Golang and pprof everyday, so I was more inclined towards adding support for pprof :)
To be clear, both approaches should support pprof properly. pprof can output the callgrind format as I explained in the issue description :-)
(e.g. the docs seem to suggest targeting the "Processed profile format" instead of the "Gecko profile format"), but I'm sure I'll get there once I dig a little deeper
This one took me a while to grasp too, what my algorithm does is produce the "processed profile format", which basically you default to having a series of parallel arrays, rather than an array full of objects. It is more efficient and easier to render I am sure, and the docs mention that it results in fewer memory allocations.
In making a converter, since it is already iterating over samples, just output one element to each array that you need to as you go, and you've got the "processed" format.
To be clear, both approaches should support pprof properly. pprof can output the callgrind format as I explained in the issue description :-)
You're right, both approaches should support pprof propely. I misread your earlier reply.
I spent some time looking at the code and specs for various profiling formats. I agree with you that the callgrind format offers more bang for the buck, given its ubiquity through valgrind. The callgrind format will be easier to implement and support as well. Its a simple ASCII text based format, which will likely be much easier (and cleaner?) to implement than pprof's binary protobuf format. I'm going to start work on implementing it this week. I'm not sure how long it will take though, I'll probably only make significant progress over the weekends :)
Hi! Just curious if you ended up implementing it @ashishbhate? This would be a great addition to the Firefox Profiler.