profiler
 profiler copied to clipboard
Only show number of memory operations if larger than zero
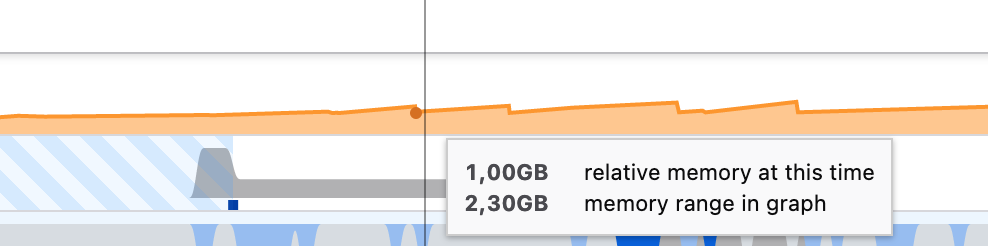
This PR hides the number of operations in imported profiles where the number might not be valid (and replaced with -1 or 0). This is a small and tested change, as redesigning the memory track is currently out of scope (and could be better achieved by using custom marker tracks).
This PR changes
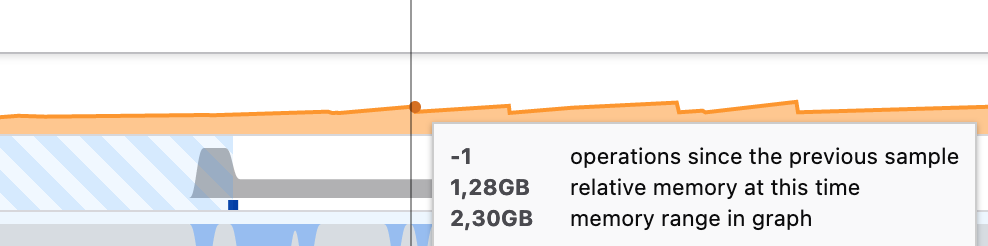 to
to
Codecov Report
Base: 88.44% // Head: 88.44% // Increases project coverage by +0.00% :tada:
Coverage data is based on head (
e587f44) compared to base (eb3c4c6). Patch coverage: 100.00% of modified lines in pull request are covered.
:exclamation: Current head e587f44 differs from pull request most recent head ecdb89f. Consider uploading reports for the commit ecdb89f to get more accurate results
Additional details and impacted files
@@           Coverage Diff           @@
##             main    #4264   +/-   ##
=======================================
  Coverage   88.44%   88.44%
=======================================
  Files         282      282
  Lines       24888    24863   -25
  Branches     6682     6668   -14
=======================================
- Hits        22012    21991   -21
+ Misses       2671     2667    -4
  Partials      205      205
| Impacted Files | Coverage Δ | |
|---|---|---|
| src/app-logic/constants.js | 100.00% <100.00%> (ø) |
|
| src/components/timeline/TrackMemoryGraph.js | 92.30% <100.00%> (+0.04%) |
:arrow_up: |
| src/profile-logic/processed-profile-versioning.js | 85.30% <100.00%> (+0.01%) |
:arrow_up: |
| src/profile-logic/profile-data.js | 90.49% <100.00%> (+<0.01%) |
:arrow_up: |
| src/test/fixtures/profiles/processed-profile.js | 94.51% <100.00%> (+0.02%) |
:arrow_up: |
| src/components/app/MenuButtons/MetaInfo.js | 82.71% <0.00%> (-2.71%) |
:arrow_down: |
| src/components/shared/SourceView-codemirror.js | 90.81% <0.00%> (-0.10%) |
:arrow_down: |
| src/components/timeline/TrackContextMenu.js | 92.37% <0.00%> (-0.05%) |
:arrow_down: |
| src/components/tooltip/Marker.js | 98.41% <0.00%> (-0.04%) |
:arrow_down: |
| src/profile-logic/marker-data.js | 93.35% <0.00%> (-0.03%) |
:arrow_down: |
| ... and 6 more |
Help us with your feedback. Take ten seconds to tell us how you rate us. Have a feature suggestion? Share it here.
:umbrella: View full report at Codecov.
:loudspeaker: Do you have feedback about the report comment? Let us know in this issue.
So with -1 we could argue that the profile data is incorrect...
That's the reason why I chose 0.
I wonder if we should use null in that case instead of -1 (which is a cheap hack)
null would probably not be a cheap hack, as null + null !== null, but -1 + -1 < 0 and 0 + 0 <= 0
null would probably not be a cheap hack, as null + null !== null, but -1 + -1 < 0 and 0 + 0 <= 0
Yes, I meant that the cheap hack is using -1, but using null could be the right solution... But it's possible I didn't understand all the cases.
I see other counters we use just put "0" in this information. This is really wasting space in the profile. Then now I believe it would be better to make this property optional, so that it could just be missing in the counters than don't use that. For other counters than memory, they don't use it, so that won't impact them anyway, and for the memory counter this would support your use case.
What do you think?
I think we should bump the processed format version,
The reason is that profiles without the property crash with the current production version because the existing code accesses it directly.
hey @parttimenerd, I don't see a change about the version here, did you forget to push the changes?