profiler

profiler copied to clipboard
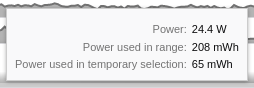
Show the sum of the power usage in power track's tooltips
I won't be able to change it more before my holidays but I believe it's fairly ready now. Please change the labels if needed and then merge when approved :-)
Please look at the individual commits. The first commits are "technical" in that they're extracting the tooltip rendering into its own component and file, so that we won't rerender the graph for each new preview selection.
Codecov Report
Merging #4172 (8ca762f) into main (78cc919) will increase coverage by
0.01%. The diff coverage is100.00%.
@@            Coverage Diff             @@
##             main    #4172      +/-   ##
==========================================
+ Coverage   88.43%   88.44%   +0.01%
==========================================
  Files         280      281       +1
  Lines       24564    24587      +23
  Branches     6557     6559       +2
==========================================
+ Hits        21722    21747      +25
+ Misses       2640     2638       -2
  Partials      202      202
| Impacted Files | Coverage Δ | |
|---|---|---|
| src/components/timeline/TrackPowerGraph.js | 93.47% <100.00%> (+0.71%) |
:arrow_up: |
| src/components/tooltip/TrackPower.js | 100.00% <100.00%> (ø) |
Help us with your feedback. Take ten seconds to tell us how you rate us. Have a feature suggestion? Share it here.