profiler
 profiler copied to clipboard
Idle java threads fill entire timeline
See also https://bugzilla.mozilla.org/show_bug.cgi?id=1766532 for required platform changes.
Idle java threads (except for the main thread) are unexpectedly filling the timeline while idle:
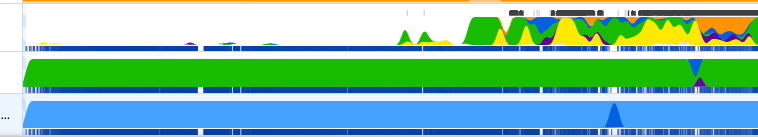
See this profile: https://share.firefox.dev/3vOqsBy
We should do what we do for the java main thread where the idling call doesn't appear on the timeline. The two methods that seem to trigger this are:
java.lang.Object.waitorg.mozilla.gecko.mozglue.GeckoLoader.nativeRun
One issue is that there may be legitimate uses of Object.wait that we want to see in the timeline but using it is discouraged over higher-level concurrency APIs so it's probably okay.
┆Issue is synchronized with this Jira Task
For C++ threads we have fixed this problem by measuring elapsed CPU time between samples, and making the graph CPU-usage aware. If our Java sampling could sample elapsed CPU times as well, this might be a good way to fix it.
Another more far-reaching way to address this would be to integrate Java thread sampling more with C++ sampling; if all the Java threads were registered with the C++ sampler, we could, for each Java thread, sample the Java and C++ stacks in the same sample and just use the same CPU delta for both.
I discovered a naive way to fix it. We could change the categories of the methods to idle:
I'm thinking we can land this naive change (I'm currently working on it) and we can file a follow-up for a more robust solution like mstange suggested.
Since the sampler in the platform code also needs to be updated for the naive solution, I filed https://bugzilla.mozilla.org/show_bug.cgi?id=1766532 as a companion bug.
I discovered a sample non-idling use case with my naive suggestion implemented https://share.firefox.dev/3xVyoUb:

The code between these two peaks is actually calling GeckoResult.poll -> Object.wait (i.e. it's blocking and not just idle). The naive change is actually very misleading. It looks like this code is doing nothing when it could actually be a source of slowdown for performance issues. I think we should do as mstange suggested.
Since the non-naive solution is more complex, I won't be working on it right now.
What I suggested will actually have the same result: The blocking wait doesn't take up any CPU time, so the graph will show 0% CPU. The same happens for C++ threads. I was initially very concerned that this would cause confusion, but so far it's been fine, because C++ threads have "jank" bars if their event loop is blocked for more than 50ms.
So I wonder if all solutions here require the addition of jank markers to Java threads. Is it even possible to get event loop information for these threads?