Support importing Instruments profiles
#1138
As a part of GSoC’19, this PR makes Firefox Profiler able to process and visualize profiles generated by Instruments Profiler which is a great macOS sampling profiler tool that’s part of Xcode toolset.
This allows users on macOS to use Firefox Profiler for analyzing and visualizing the Instruments profiles.
Example Instruments profile in Firefox Profiler: https://perfht.ml/2OOYDGY
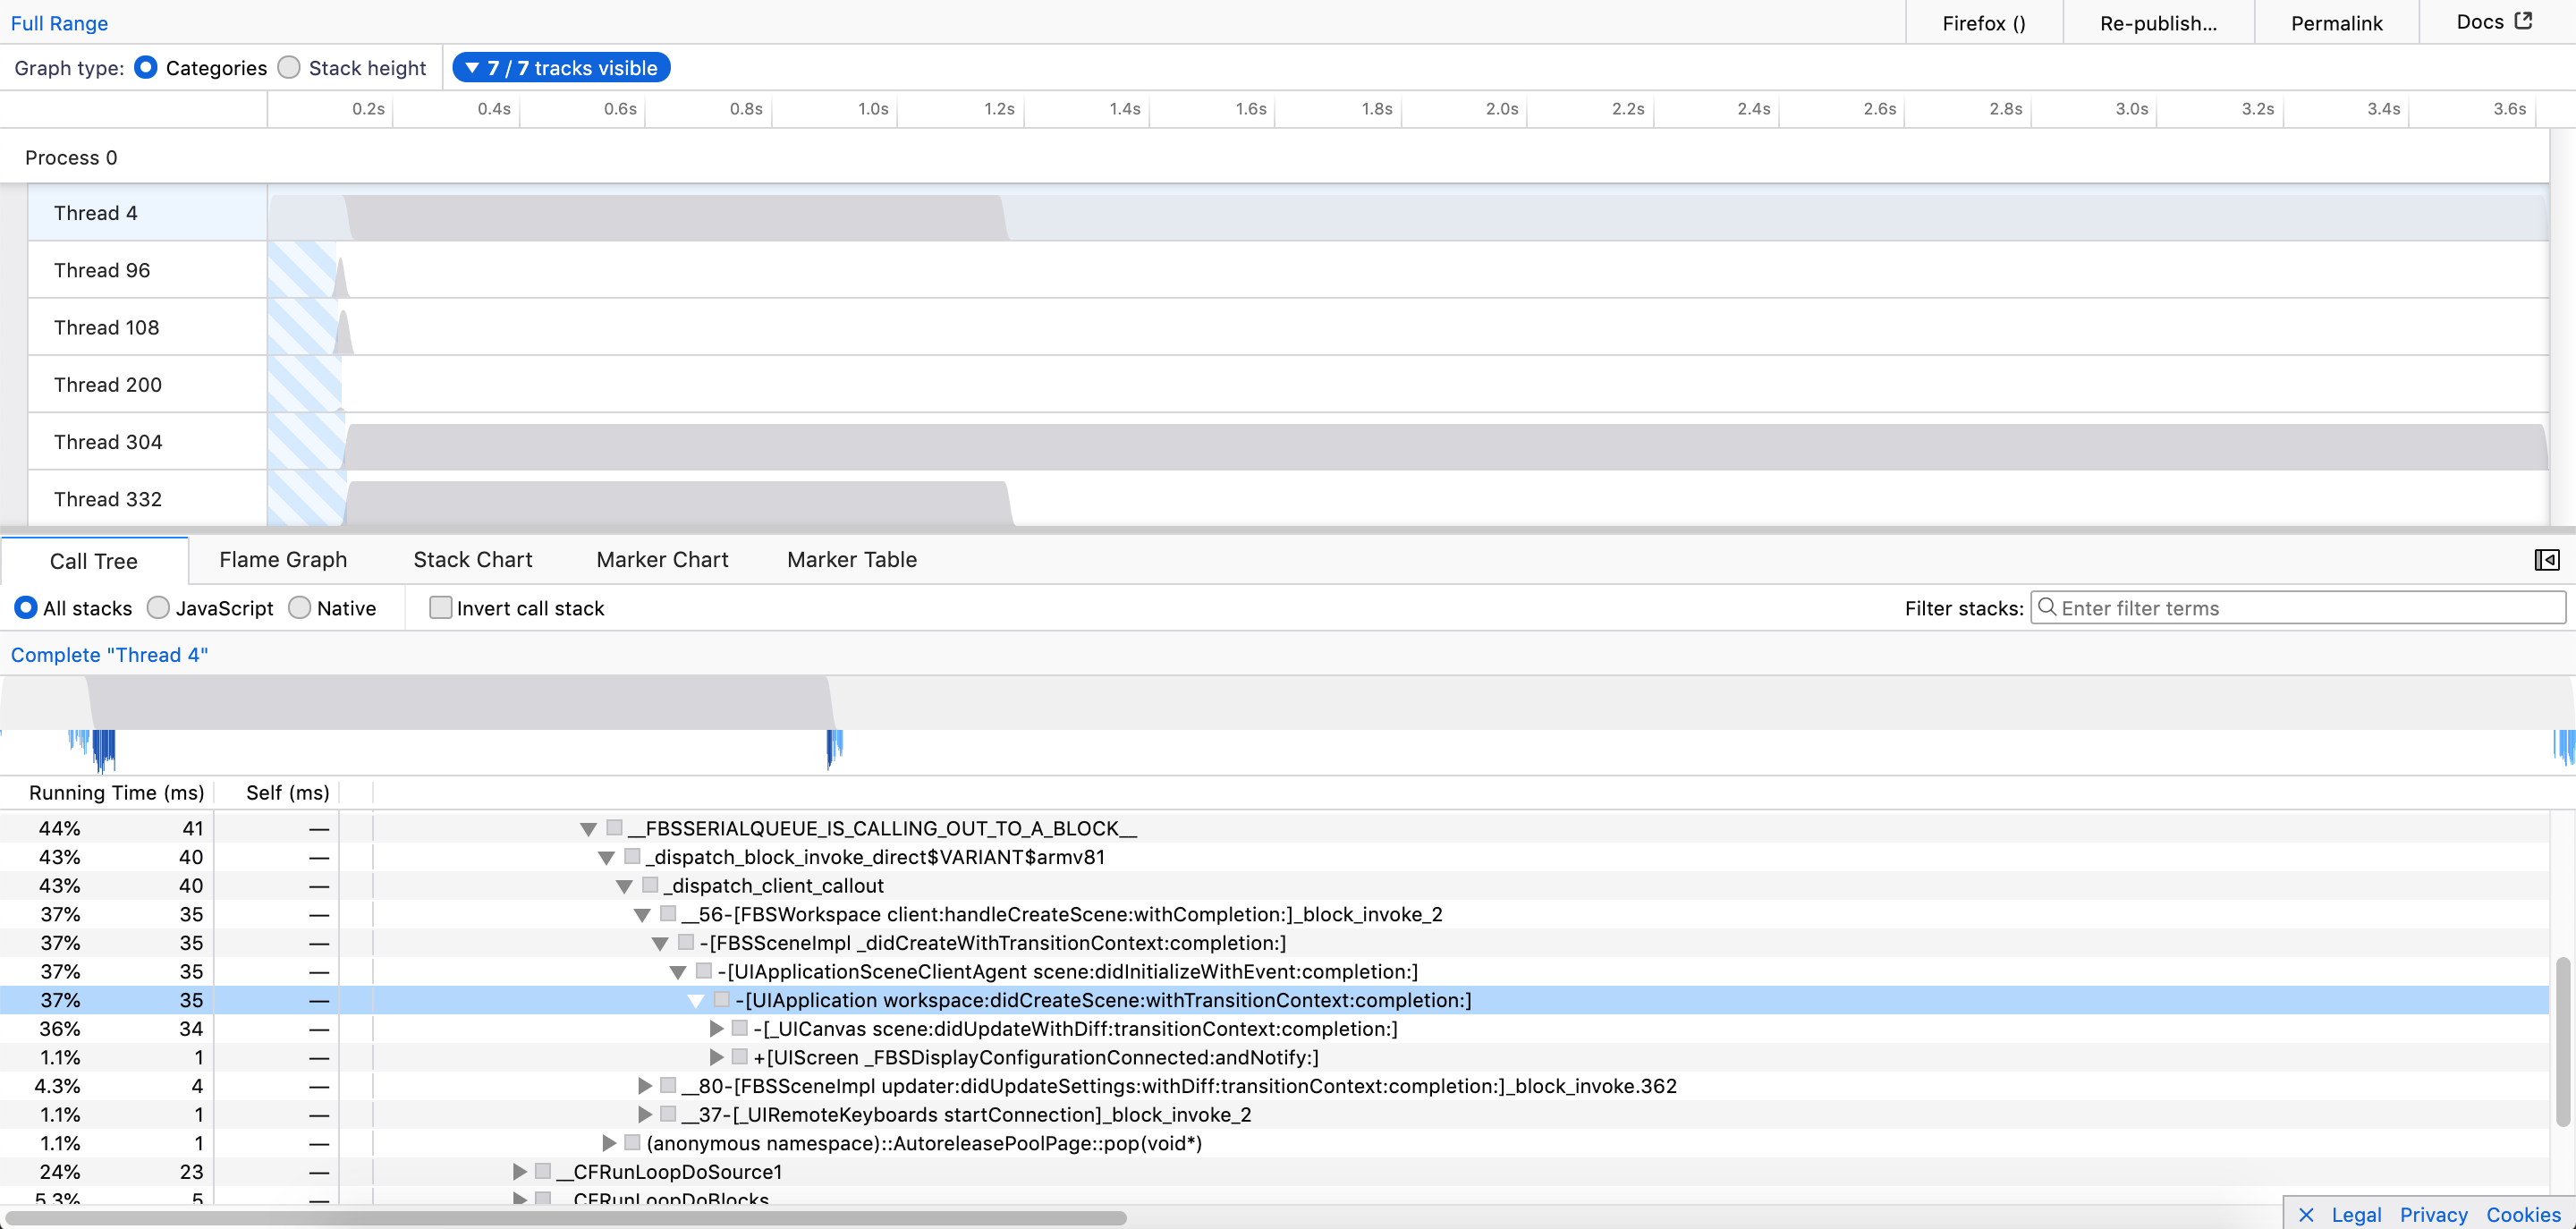
Call Tree:
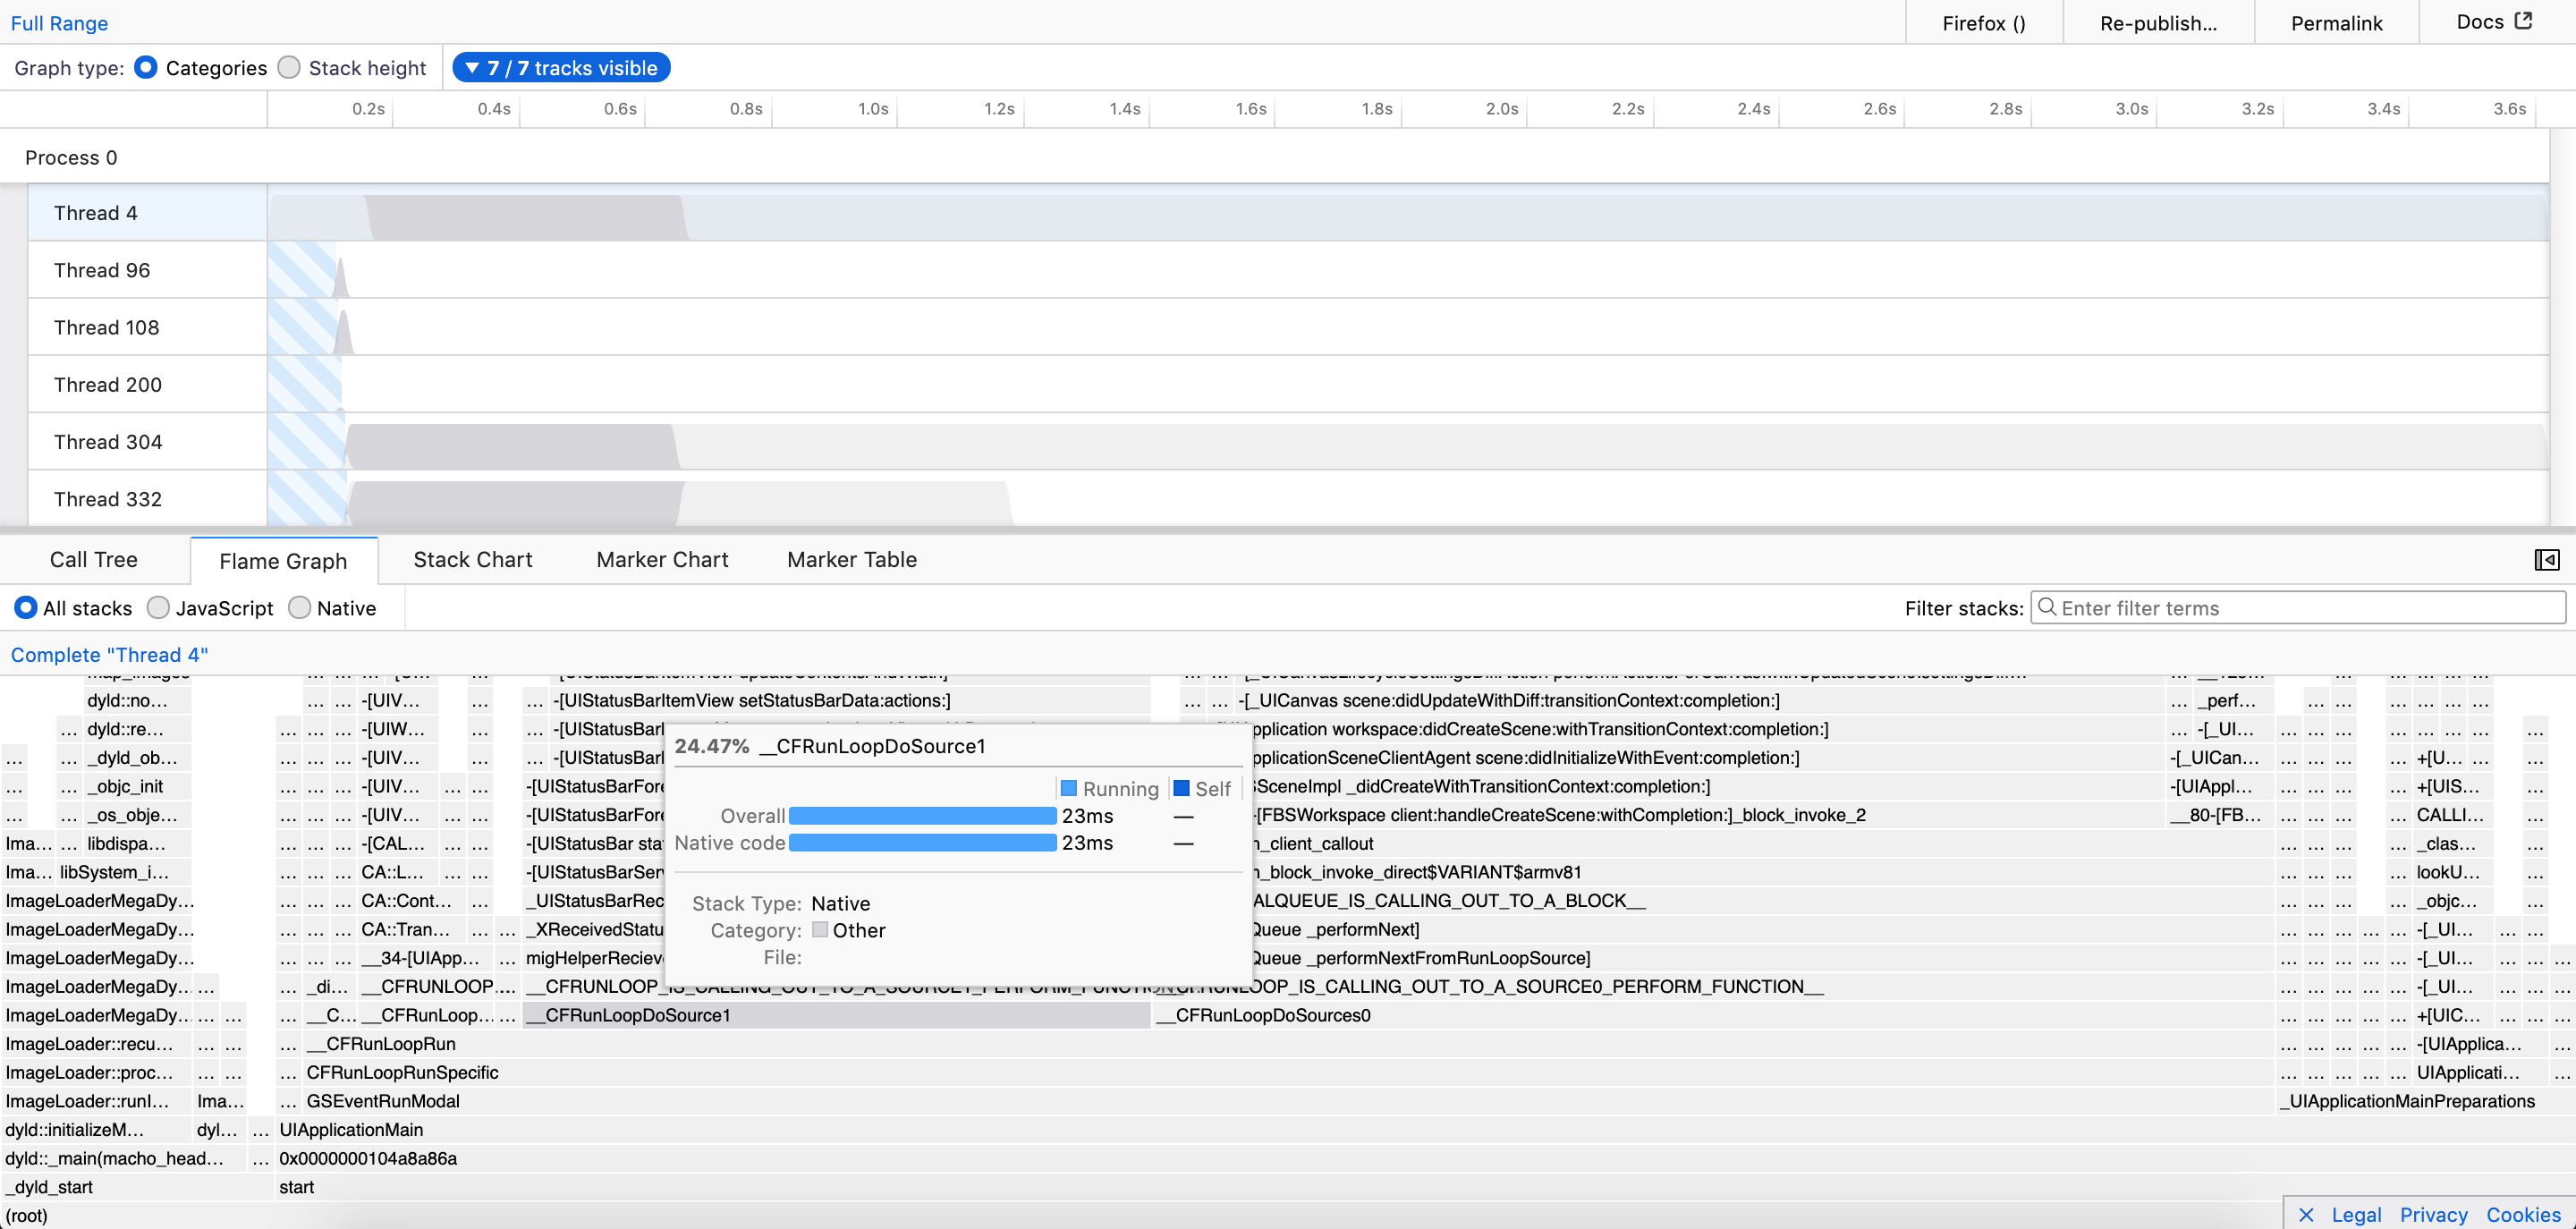
Flame Graph:
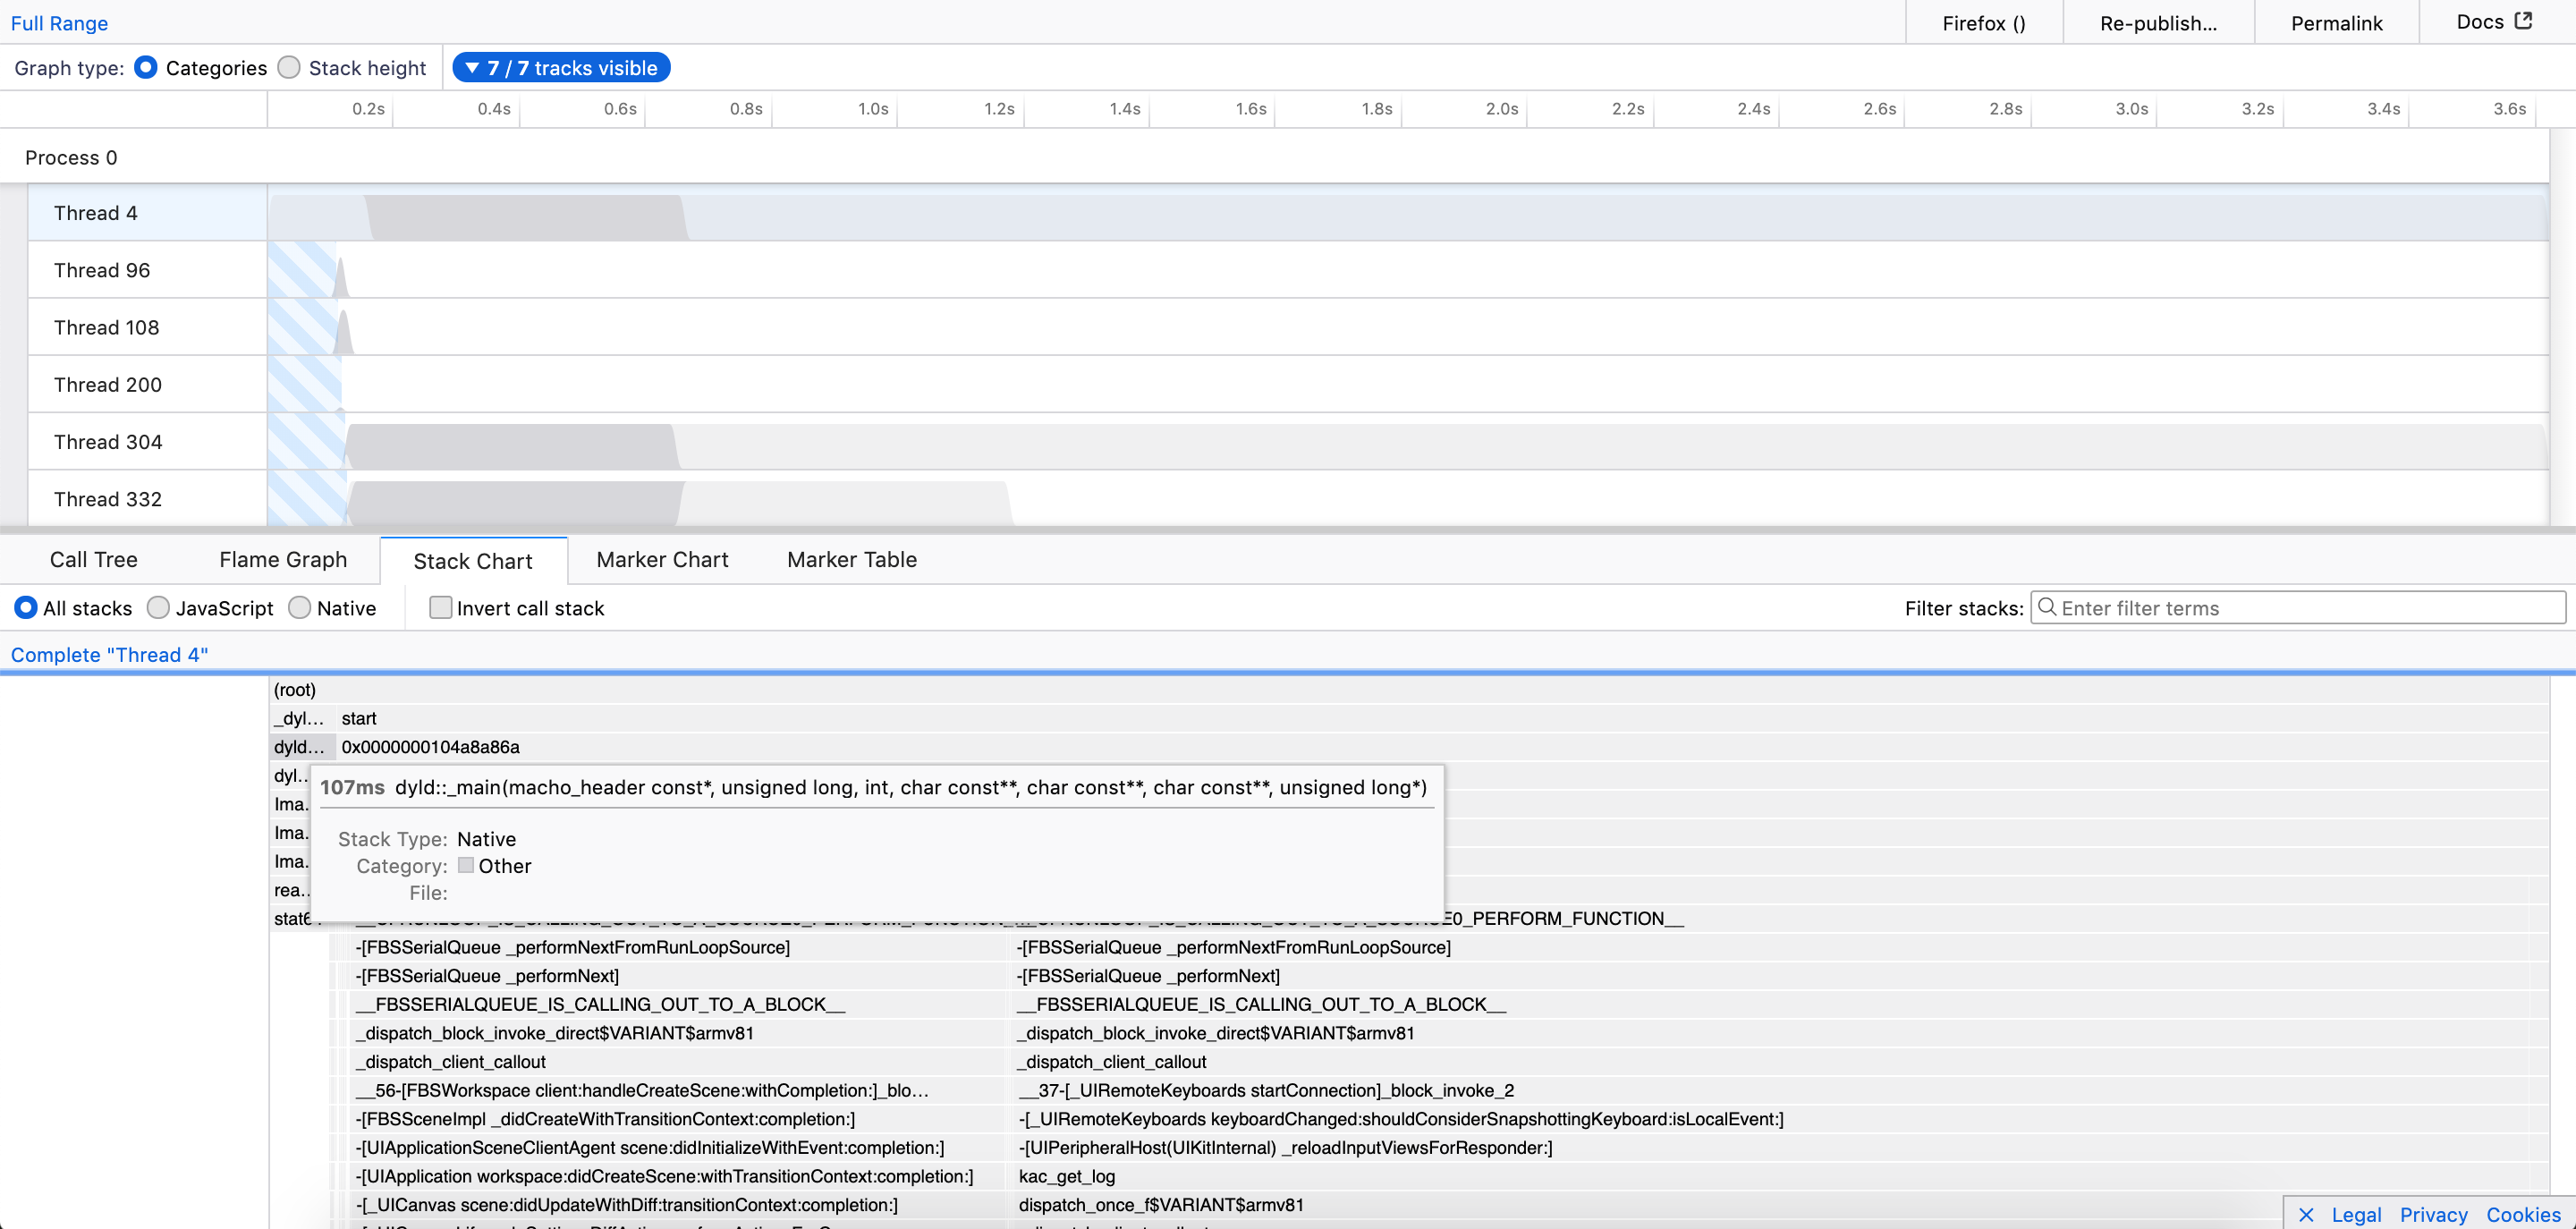
Stack Chart:
┆Issue is synchronized with this Jira Task
Codecov Report
Merging #2138 into master will decrease coverage by
0.36%. The diff coverage is84.15%.

@@            Coverage Diff             @@
##           master    #2138      +/-   ##
==========================================
- Coverage   86.14%   85.77%   -0.37%
==========================================
  Files         204      204
  Lines       15149    14602     -547
  Branches     3809     3658     -151
==========================================
- Hits        13050    12525     -525
+ Misses       1922     1899      -23
- Partials      177      178       +1
| Impacted Files | Coverage Δ | |
|---|---|---|
| src/components/app/Home.js | 50.45% <0%> (-6.7%) |
:arrow_down: |
| src/profile-logic/import/instruments/BinReader.js | 67.74% <67.74%> (ø) |
|
| src/actions/receive-profile.js | 84.8% <75%> (-0.19%) |
:arrow_down: |
| ...-logic/import/instruments/MaybeCompressedReader.js | 83.87% <83.87%> (ø) |
|
| ...file-logic/import/instruments/BinaryPlistParser.js | 87.2% <87.2%> (ø) |
|
| src/profile-logic/import/instruments/index.js | 87.46% <87.46%> (ø) |
|
| src/actions/publish.js | 83.58% <0%> (-7.33%) |
:arrow_down: |
| src/selectors/per-thread/stack-sample.js | 90.38% <0%> (-4.26%) |
:arrow_down: |
| src/components/timeline/TrackContextMenu.js | 86.71% <0%> (-2.56%) |
:arrow_down: |
| src/components/marker-chart/Canvas.js | 91.04% <0%> (-2.33%) |
:arrow_down: |
| ... and 71 more |
Continue to review full report at Codecov.
Legend - Click here to learn more
Δ = absolute <relative> (impact),ø = not affected,? = missing dataPowered by Codecov. Last update 0dfcbb6...065af02. Read the comment docs.
I'll need a bit more time before I have time to look at this. Just letting everyone know.
I think I answered all pending questions, but didn't look at the new code. Also I see some comments are still unresolved, do you need more information about them?
Also again, as you're doing that in your free time, please tell us if you'd like that we help you finishing this up, because this needs a bit of work still and I don't want to put pressure on you. This would be really a pleasure to help you with this :)
I am no longer able to load a .trace file (/ directory) in the deploy preview using Firefox Nightly. Is this a Firefox Nightly bug? When I try to choose the .trace item in the file open dialog, Firefox always goes inside the directory and wants me to choose a file. But I want to choose the whole directory. Dragging and dropping the directory into the home page doesn't work either.
@julienw , There are 8 more comments which are unresolved. I'll try to resolve all of them by this week. Thanks! :)
@julienw, Apple BinaryPlist data format is very unstructured.
For example, root.$objects (one of the parameter in expandKeyedArchive function) array looks like this:
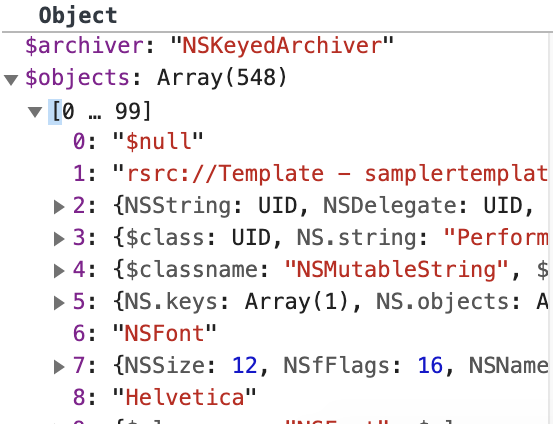
So it's hard to define a type for this kind of arrays or objects. That's why I had to put any types for these kinds of instances.
cc: @canova
hey raj, a quick note that we didn't forget you, but we've been super busy lately. I still want to look at this soon...
@julienw, I have resolved your latest comments and made the changes. Thanks for your valuable comments!
Whoa, I just found some actual documentation! It's packaged inside Instruments.app: file:///Applications/Xcode.app/Contents/Applications/Instruments.app/Contents/Packages/Sampling.instrdst/Contents/Documentation/fulldoc.html
If you view a profile in Instruments, you can access this documentation by going to: Main Menu -> Instrument -> Instrument Inspector -> Schemas -> time-profile. This documentation links to documentation on help.apple.com such as the one for the "backtrace" engineering type: https://help.apple.com/instruments/developer/mac/current/#/dev15401019
I have a bug report: Inlined frames seem to be assigned to the wrong parent. It seems they're lifted up one level and become a sibling of their actual parent. To reproduce, load this trace: https://drive.google.com/file/d/1fAMdpODaax4Nk4m5jLUbOdulLt_y8MG2/view?usp=sharing
Instruments (correct):
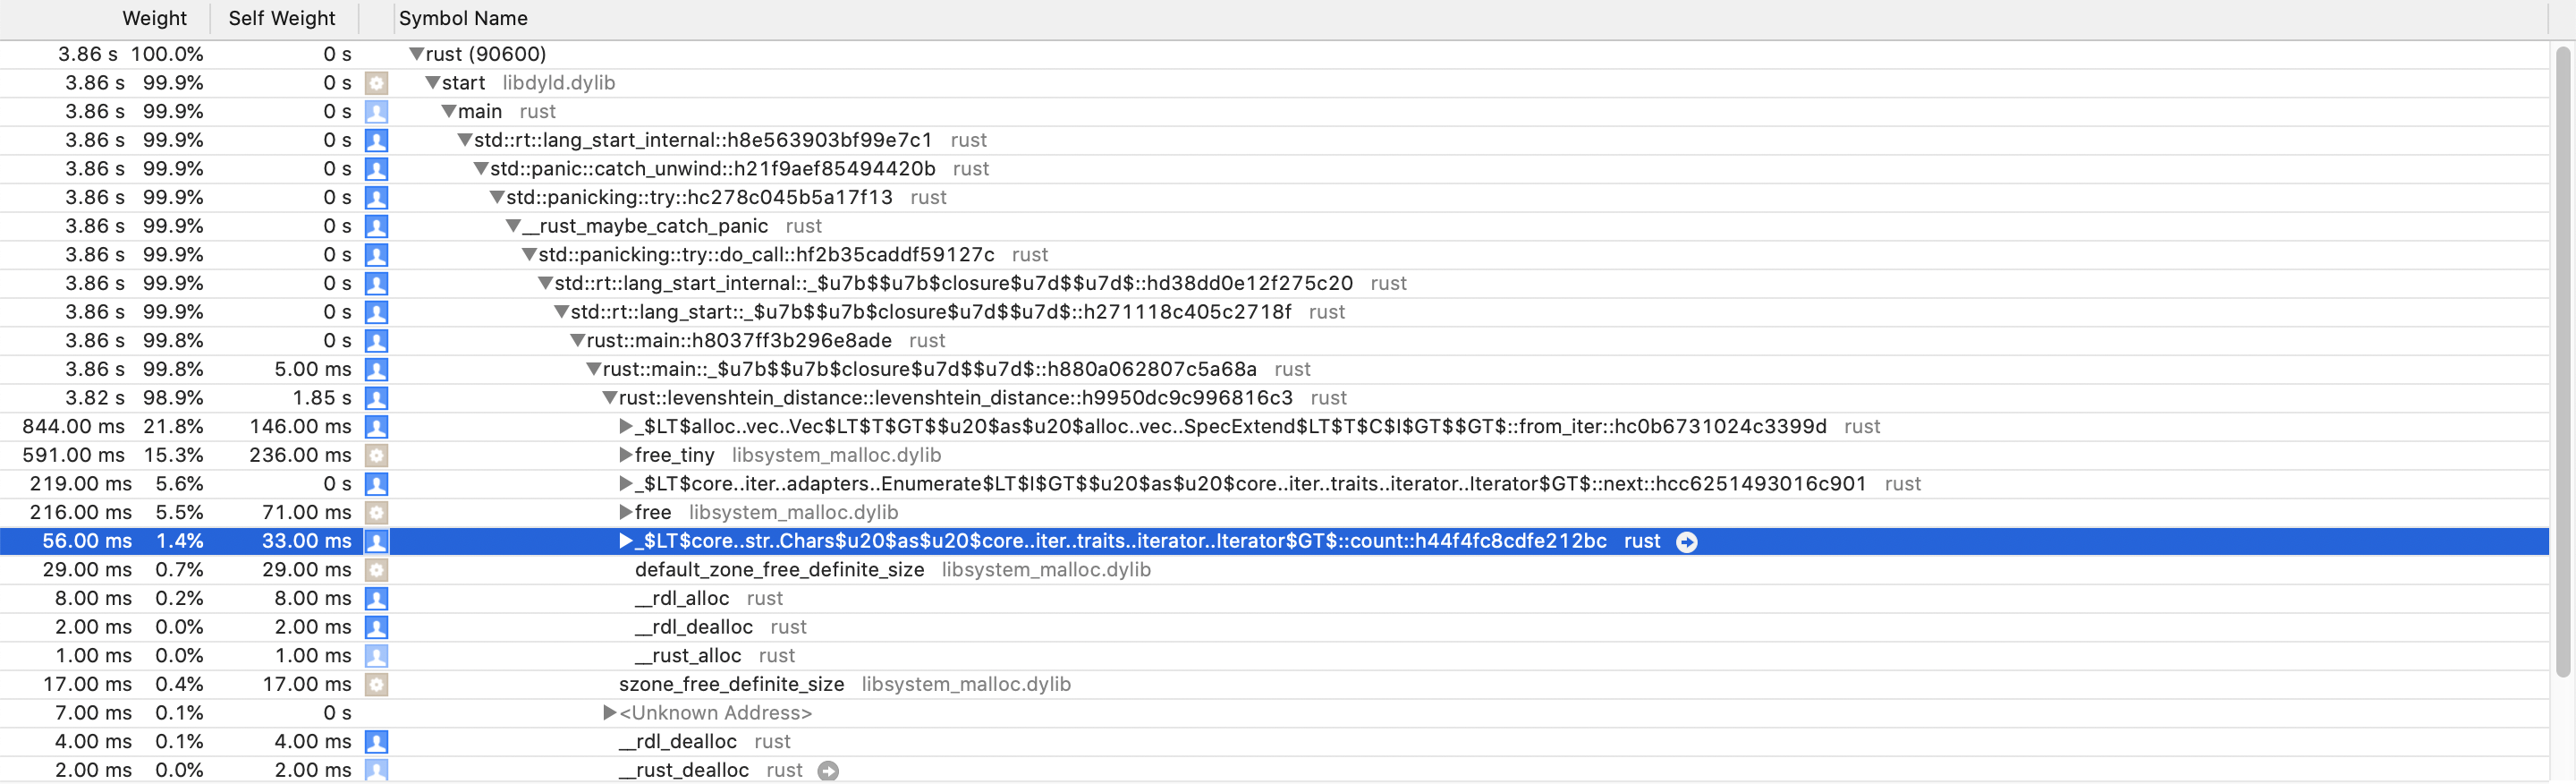
Firefox profiler (incorrect): https://perfht.ml/3aY8qAx
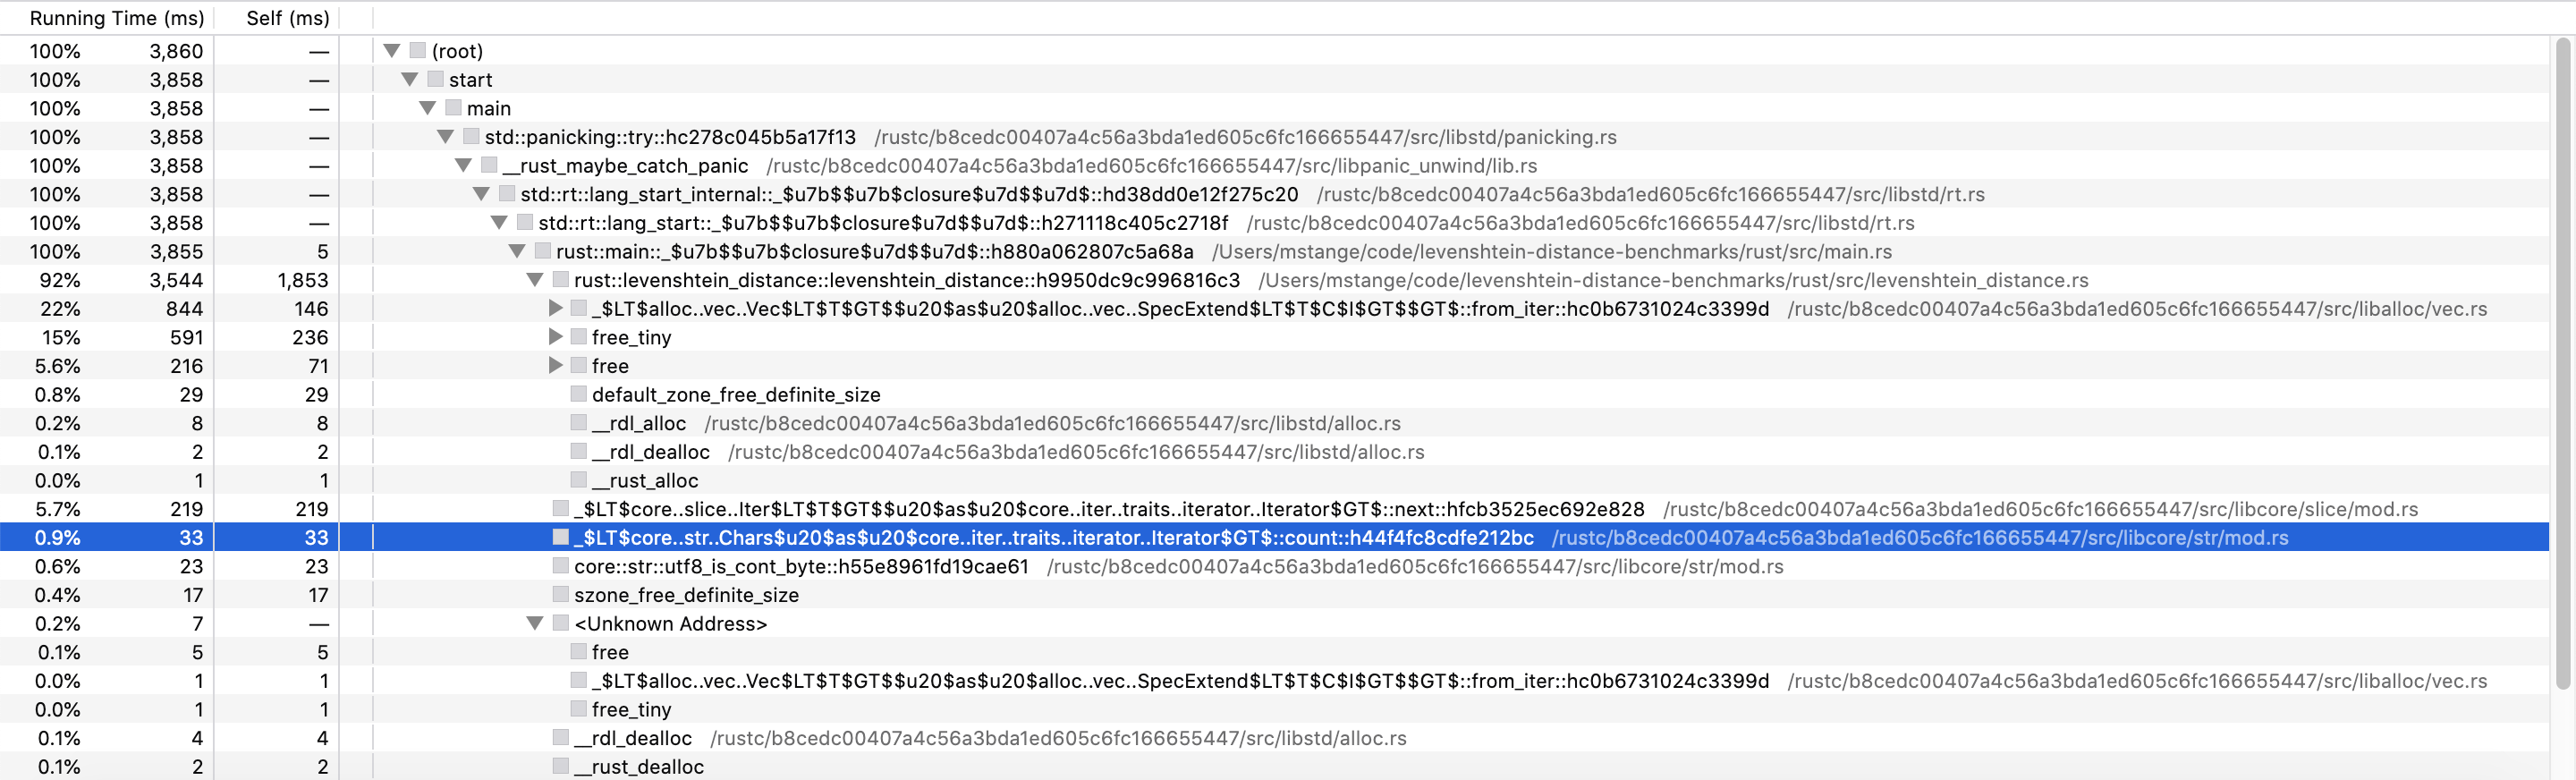
In this example, the "count" method (_$LT$core..str..Chars$u20$as$u20$core..iter..traits..iterator..Iterator$GT$::count::h44f4fc8cdfe212bc) should be called by the "levenshtein_distance" method (rust::levenshtein_distance::levenshtein_distance::h9950dc9c996816c3). But in the imported profile, the "count" method is called by the "main" method instead (rust::main::_$u7b$$u7b$closure$u7d$$u7d$::h880a062807c5a68a).
This implementation also seems to create huge frameTables / funcTables / stringTables. It seems every thread has all the strings for all the threads. And the frameTable.address values seem wrong.