chart-fx
 chart-fx copied to clipboard
Data styles of LimitedIndexedTreeDataSet not picked up correctly by ErrorDataSetRenderer when point reduction is disabled and x-axis range reduced
Describe the bug
We use a chart with a LimitedIndexedTreeDataSet in which we assign data styles (e.g. marker symbol, marker color) to the data points, and an ErrorDataSetRenderer for rendering. The x-axis range of the chart can be changed (e.g. 1h - 2h - 4h).
When point reduction is set to false for the renderer, making the x-axis range smaller leads to some data points being displayed with the wrong data style (instead, either the default data set style is used or a wrong data style is used).
The data points are displayed as expected, with their styles applied, when point reduction is set to true for the renderer. Also, the data points are displayed as expected when the x-axis range is increased.
To Reproduce Using the minimal example below:
- Start demo app
- Add data via button: Values > 0 should have red markers, < 0 green markers.
- Choose smaller time span (1h) via button
- EDITED TO ADD: The bug also occurs if step 3 is performed before step 2.

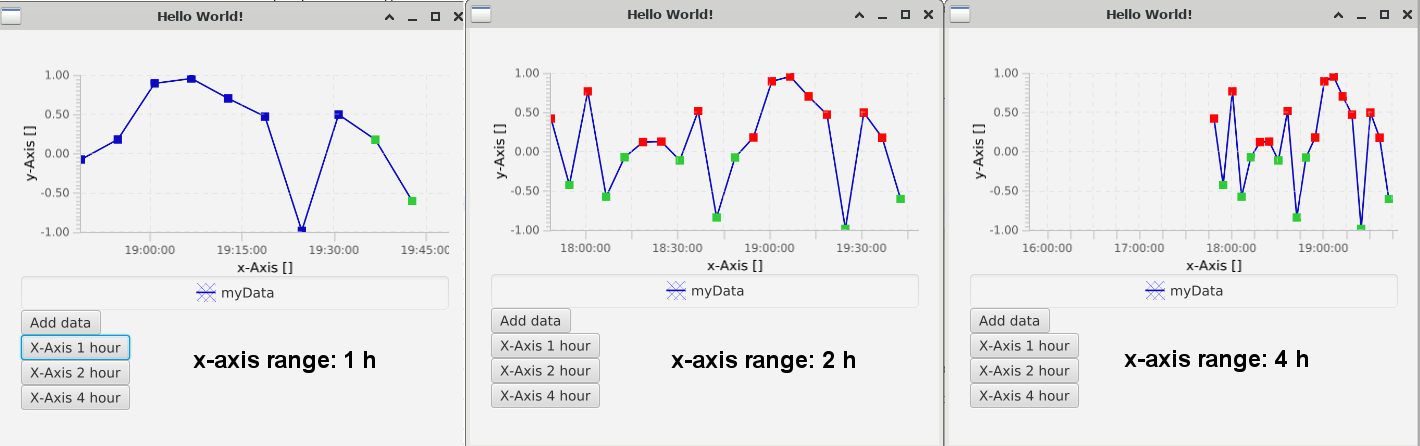
Expected: Marker styling remains the same for each marker Actual: Some markers do not have any styling, some have the wrong styling. (See screenshots: left / 1 h).
public class DEMO_StylesAndLimitedTreeDataSet extends Application {

    private static final Logger LOGGER = LoggerFactory.getLogger(DEMO_StylesAndLimitedTreeDataSet.class);
    private ErrorDataSetRenderer datasetRenderer;
    private LimitedIndexedTreeDataSet dataSet;

    public static void main(final String[] args) {
        launch(args);
    }

    /*
     * To reproduce:
     *
     * - Start demo app
     *
     * - Add data via button: Values > 0 should have red markers, < 0 green markers.
     *
     * - Choose smaller time span (1h) via button
     *
     * Expected: Marker styling remains the same for each marker
     *
     * Actual: Some markers do not have any styling, some have the wrong styling.
     *
     * - For 2h and 4h time spans, the marker styling appears to be correct.
     *
     * Possibly a caching issue (index of _displayed_ points?) in the renderer?
     */

    @Override
    public void start(final Stage primaryStage) {
        primaryStage.setTitle("Hello World!");

        final StackPane root = new StackPane();
        root.setPadding(new Insets(20));

        final XYChart chart = new XYChart();

        final DefaultNumericAxis yAxis = (DefaultNumericAxis) chart.getYAxis();
        yAxis.setAutoGrowRanging(false);
        yAxis.setAutoRanging(false);
        yAxis.setAutoRangeRounding(false);
        yAxis.set(-1, 1);

        final DefaultNumericAxis xAxis = (DefaultNumericAxis) chart.getXAxis();
        configureXAxis(xAxis);

        final Instant timeMin = Instant.now();
        final Instant timeMax = timeMin.plus(2, ChronoUnit.HOURS);

        dataSet = new LimitedIndexedTreeDataSet("myData", 5000, Duration.ofHours(3).toSeconds());
        dataSet.setStyle("markerSize: 4;");

        datasetRenderer = new ErrorDataSetRenderer();

        // when point reduction is deactivated, the visual problems occur
//        datasetRenderer.setPointReduction(true); // ok
        datasetRenderer.setPointReduction(false); // not ok <======= here is the issue!

        chart.getRenderers().set(0, datasetRenderer);

        // adding data set to chart or renderer makes no difference
//        chart.getDatasets().add(dataSet);
        datasetRenderer.getDatasets().add(dataSet);

        final Button addDataButton = new Button("Add data");
        addDataButton.setOnAction(evt -> {
            dataSet.clearData();
            final int dataCount = 20;
            final long distanceInSeconds = Duration.between(timeMin, timeMax).getSeconds() / dataCount;
            for (int i = 0; i < dataCount; i++) {
                final double x = timeMin.getEpochSecond() + i * distanceInSeconds;
                final double y = ThreadLocalRandom.current().nextDouble(-1, 1);
                dataSet.add(x, y);

                final int xIndex = dataSet.getIndex(DataSet.DIM_X, x);
                final String style = determineMarkerColorStyling(y);
                dataSet.addDataStyle(xIndex, style);
                LOGGER.debug("Adding data point: x={} y={} style={}", x, y, style);
            }
        });

        final Button shortTimeButton = new Button("X-Axis 1 hour");
        shortTimeButton.setOnAction(evt -> {
            updateMinMax(xAxis, timeMax.minus(1, ChronoUnit.HOURS).getEpochSecond(), timeMax.getEpochSecond());
        });

        final Button longTimeButton = new Button("X-Axis 2 hour");
        longTimeButton.setOnAction(evt -> {
            updateMinMax(xAxis, timeMax.minus(2, ChronoUnit.HOURS).getEpochSecond(), timeMax.getEpochSecond());
        });
        final Button longerTimeButton = new Button("X-Axis 4 hour");
        longerTimeButton.setOnAction(evt -> {
            updateMinMax(xAxis, timeMax.minus(4, ChronoUnit.HOURS).getEpochSecond(), timeMax.getEpochSecond());
        });

        updateMinMax(xAxis, timeMin.getEpochSecond(), timeMax.getEpochSecond());

        final VBox container = new VBox(chart, addDataButton, shortTimeButton, longTimeButton, longerTimeButton);

        root.getChildren().add(container);
        primaryStage.setScene(new Scene(root, 450, 400));
        primaryStage.setOnCloseRequest(evt -> {
            Platform.exit();
            System.exit(0); // NOPMD
        });
        primaryStage.show();
    }

    private static void configureXAxis(final DefaultNumericAxis xAxis) {
        xAxis.setForceZeroInRange(false);
        xAxis.setAnimated(false);
        xAxis.setTimeAxis(true);
        xAxis.setMinorTickCount(0);

        final DefaultTimeFormatter formatter = new DefaultTimeFormatter(xAxis);

        xAxis.setAxisLabelFormatter(formatter);
        xAxis.setTickLabelFormatter(formatter);
        xAxis.setAutoGrowRanging(false);
        xAxis.setAutoRanging(false);
        xAxis.setAutoRangeRounding(false);
    }

    private void updateMinMax(DefaultNumericAxis axis, final double min, final double max) {
        axis.autoNotification().set(false);
        axis.set(min, max);
        axis.autoNotification().set(true);
        axis.forceRedraw();

        LOGGER.debug(
                "Updating x range: newMinX={} ({}), newMaxX={} ({})",
                min,
                Instant.ofEpochSecond((long) min),
                max,
                Instant.ofEpochSecond((long) max));

        // printout shows that each point still has its correct style!
        printDataPointStyles(dataSet);
    }

    private static String determineMarkerColorStyling(final double y) {
        return y > 0 ? "markerColor=red;" : "markerColor=limegreen;";
    }

    private static void printDataPointStyles(final LimitedIndexedTreeDataSet dSet) {
        final int dataSize = dSet.getDataCount();
        for (int i = 0; i < dataSize; i++) {
            final String style = dSet.getStyle(i);
            if (style != null) {
                final double x = dSet.get(DataSet.DIM_X, i);
                LOGGER.debug("Style: x={} ({}) style={}", x, Instant.ofEpochSecond((long) x), style);
            }
        }
    }

}
Environment:
- OS:
Linux 4.18.0-348.12.2.el8_5.x86_64 #1 SMP Wed Jan 19 17:53:40 UTC 2022 x86_64 x86_64 x86_64 GNU/Linux - Java version: openjdk version "11.0.14" 2022-01-18 LTS
- JavaFx version: 17.0.2
- ChartFx version: master
(By the way, this is Anne from GSI/APP. 😃 )
Hey, thanks for the detailed report and reproducer! The reduction algorithm has special treatment for styled/labeled points, probably fixing some inconsistency in the indexing of the dataset.
I started looking into it a bit, but I the places I would have suspected the problem look correct on first glance, so I'll have to dig deeper.
Hi, an additional tidbit of information: I have encountered some situations in which the data point styles were not drawn correctly even when point reduction is set to true for the renderer (and in which there should have been no active reduction - points were spaced far apart). See screenshot: All charts have a renderer with pointReduction=true and have data styles configured for all their data points, but when showing only 1 h of data, some charts do not show the data styles. For larger timespans (x-ranges), the styling is displayed correctly.
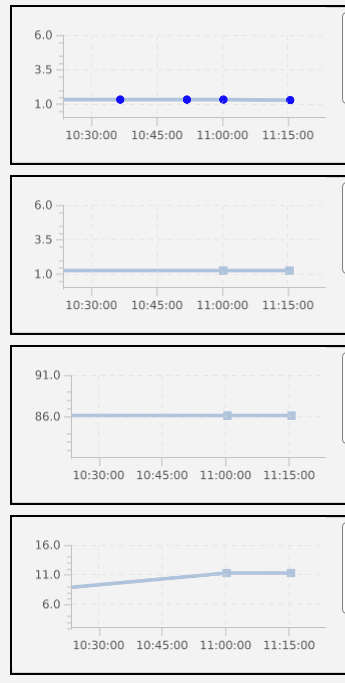
Unfortunately, I have not been able to reproduce this behavior with the provided example code. Maybe it is related to larger datasets, I am not sure, but wanted to let you know in case it helps.
Cheers, Anne
We just released chart-fx 11.3.0, with lots of improvements on rendering consistency and styling, so it would be interesting to see if this issue still exists in this release.