react-native
 react-native copied to clipboard
Native crash SIGSEGV: Segfault __kernel_rt_sigreturn
Description
Hello everyone, today i saw in our Sentry that we have some unhandled issues. I will post screenshot from Sentry.

Version
0.64.3
Output of npx react-native info
System: OS: macOS 12.6 CPU: (10) arm64 Apple M1 Max Memory: 3.62 GB / 32.00 GB Shell: 5.8.1 - /bin/zsh Binaries: Node: 18.6.0 - /opt/homebrew/bin/node Yarn: 1.22.19 - /usr/local/bin/yarn npm: 8.13.2 - /opt/homebrew/bin/npm Watchman: 2022.07.04.00 - /opt/homebrew/bin/watchman Managers: CocoaPods: 1.11.3 - /opt/homebrew/bin/pod SDKs: iOS SDK: Platforms: DriverKit 21.4, iOS 15.5, macOS 12.3, tvOS 15.4, watchOS 8.5 Android SDK: Not Found IDEs: Android Studio: 2021.2 AI-212.5712.43.2112.8609683 Xcode: 13.4.1/13F100 - /usr/bin/xcodebuild Languages: Java: 11.0.15 - /usr/bin/javac npmPackages: @react-native-community/cli: Not Found react: 17.0.1 => 17.0.1 react-native: 0.64.3 => 0.64.3 react-native-macos: Not Found npmGlobalPackages: react-native: Not Found
Steps to reproduce
I dont know how to reproduce.When i test with android studio, sometimes after launch app emulator just crash and 2nd launch is good. Maybe in real device is the same.
Snack, code example, screenshot, or link to a repository


There is nothing we can without a reproducer sadly. Are you able to reproduce locally in any form?
I also have been noticing these __kernel_rt_sigreturn Sentry errors for a few months now but not sure what's the issue at the moment.


~~(after trying a lot, I removed the expo-sentry (Sentry.init) and I couldn't reproduce it on my Samsung device (as this happens there) any more. so seeing this issue on a react-native channel, I suppose this issue should be related to react-native-sentry rather than expo-sentry)~~
I suppose this issue should be related to
react-native-sentryrather thanexpo-sentry
Don't you mind opening an issue here https://github.com/getsentry/sentry-react-native/issues and link against this one?
@cortinico I'm sorry for the wrong information I gave (didn't do it intentionally). As a matter of the fact, it wasn't expo-sentry, I just removed my yarn.lock and installed packages again.
I know how crazy this can be, but that was the only way for my project :)
Facing the same native crash on some Samsung devices running on android 12.
I also facing this issue with my project, I'm not sure which kind of details might relate. Basic most native libs of my project are: I'm using wix/RNN v7.30.0-alpha.1 react-i18next: "^11.18.6" @giphy/react-native-sdk
And so far very common properties of my crashes are: They're always the first or second screen of my app(LandingPage, WelcomePage) and all the error origin phones are using Android12
I got this issue fixed by enabling Hermes. Earlier, hermes in my project was disabled because of some reason so had to turn it on to avoid these crashes. Now the app works fine on Android 12.
I am also seeing those issues with latest Expo SDK 47, didn't happen before so it is connected to React Native 0.70.5+ 🤔
I'm also noticing quite a number of this error. But don't have Hermes enabled and I'm wondering if the issue was resolved for you after enabling Hermes @kumarparth380 !
Did not see this error again since I switched to Hermes on Android: https://docs.expo.dev/guides/using-hermes/#switch-javascript-engine-on-a-specific-platform
I'm still having this issue on Android 13 RN v0.67.5. Is there a possible solution @ToniNikolaev23 ?? I have enabled Hermes but nothing works.
I'm receiving this crash a lot. Any insights would be much appreciated:
backtrace:
  #00  pc 0x00000000006703bc  /data/app/[[I omitted this part]]==/lib/arm64/libjsc.so
  #01  pc 0x00000000000005d0  [vdso] (__kernel_rt_sigreturn)
  #02  pc 0x00000000000a6b78  /apex/com.android.runtime/lib64/bionic/libc.so (__epoll_pwait+8)
  #03  pc 0x0000000000017cc0  /system/lib64/libutils.so (android::Looper::pollInner(int)+192)
  #04  pc 0x0000000000017b9c  /system/lib64/libutils.so (android::Looper::pollOnce(int, int*, int*, void**)+116)
  #05  pc 0x00000000001687b0  /system/lib64/libandroid_runtime.so (android::android_os_MessageQueue_nativePollOnce(_JNIEnv*, _jobject*, long, int)+48)
  #06  pc 0x00000000001c3964  /system/framework/arm64/boot-framework.oat (art_jni_trampoline+116)
  #07  pc 0x000000000058cdd0  /system/framework/arm64/boot-framework.oat (android.os.MessageQueue.next+288)
  #08  pc 0x000000000058a0d8  /system/framework/arm64/boot-framework.oat (android.os.Looper.loopOnce+104)
  #09  pc 0x0000000000589fd0  /system/framework/arm64/boot-framework.oat (android.os.Looper.loop+560)
  #10  pc 0x00000000002ee384  /system/framework/arm64/boot-framework.oat (android.app.ActivityThread.main+1316)
  #11  pc 0x0000000000434600  /apex/com.android.art/lib64/libart.so (art_quick_invoke_static_stub+576)
  #12  pc 0x0000000000466d34  /apex/com.android.art/lib64/libart.so (_jobject* art::InvokeMethod<(art::PointerSize)8>(art::ScopedObjectAccessAlreadyRunnable const&, _jobject*, _jobject*, _jobject*, unsigned long)+1960)
  #13  pc 0x0000000000466564  /apex/com.android.art/lib64/libart.so (art::Method_invoke(_JNIEnv*, _jobject*, _jobject*, _jobjectArray*) (.__uniq.165753521025965369065708152063621506277)+48)
  #14  pc 0x0000000000099148  /system/framework/arm64/boot.oat (art_jni_trampoline+120)
  #15  pc 0x00000000005041d0  /system/framework/arm64/boot-framework.oat (com.android.internal.os.RuntimeInit$MethodAndArgsCaller.run+144)
  #16  pc 0x000000000050d4ec  /system/framework/arm64/boot-framework.oat (com.android.internal.os.ZygoteInit.main+3404)
  #17  pc 0x0000000000434600  /apex/com.android.art/lib64/libart.so (art_quick_invoke_static_stub+576)
  #18  pc 0x000000000057e378  /apex/com.android.art/lib64/libart.so (art::JValue art::InvokeWithVarArgs<_jmethodID*>(art::ScopedObjectAccessAlreadyRunnable const&, _jobject*, _jmethodID*, std::__va_list)+900)
  #19  pc 0x00000000005f1d7c  /apex/com.android.art/lib64/libart.so (art::JNI<true>::CallStaticVoidMethodV(_JNIEnv*, _jclass*, _jmethodID*, std::__va_list)+160)
  #20  pc 0x00000000000c1c04  /system/lib64/libandroid_runtime.so (_JNIEnv::CallStaticVoidMethod(_jclass*, _jmethodID*, ...)+124)
  #21  pc 0x00000000000ce470  /system/lib64/libandroid_runtime.so (android::AndroidRuntime::start(char const*, android::Vector<android::String8> const&, bool)+856)
  #22  pc 0x0000000000002570  /system/bin/app_process64 (main+1304)
  #23  pc 0x000000000004a7d4  /apex/com.android.runtime/lib64/bionic/libc.so (__libc_init+100)
Here it also started showing up heavily in sentry and crashlytics, my app crashes sometimes randomly. It started to appear after RN 0.71.*
@RalissonMattias Are you using react-native-screens, if yes then which version secondly you are able to reproduce this crash locally?
@RalissonMattias Are you using react-native-screens, if yes then which version secondly you are able to reproduce this crash locally?
@MianSaad705 Yes, I'm using react-native-screens: 3.19.0 and the crash doesn't happen locally
@RalissonMattias according to my understanding it's a crash on a fresh install and occur only one time, facing the same issue.
@MianSaad705 Yes, the same thing happens here. In your application hermes is true or false?
@MianSaad705 That must be it then, in my tests with hermes turned off, the app always closes the first time I download and enter the app. With enabled hermes this is not happening. I used to leave hermes enabled in my app, but it caused a performance drop in some situations, with it disabled the app works better
Same here but only on samsung devices, first time the app start after booting the device, it crashes, after the crash, I relaunch the app and then it works fine. Hermes is false.
I can confirm that after enabling Hermes on Android, we're no longer getting this crash.
I've commented on what appears to be linked issues:
https://github.com/expo/expo/issues/18083 https://github.com/facebook/react-native/issues/33896
I see this same behavior with samsung devices on first launch with JSC. I saw this when migrating to RN 0.70.6 (and persisted when trying to go to latest 0.71.3).
adb logcat | ~/Android/sdk/ndk/23.1.7779620/ndk-stack -sym jni/arm64-v8a/libjsc.so
********** Crash dump: **********
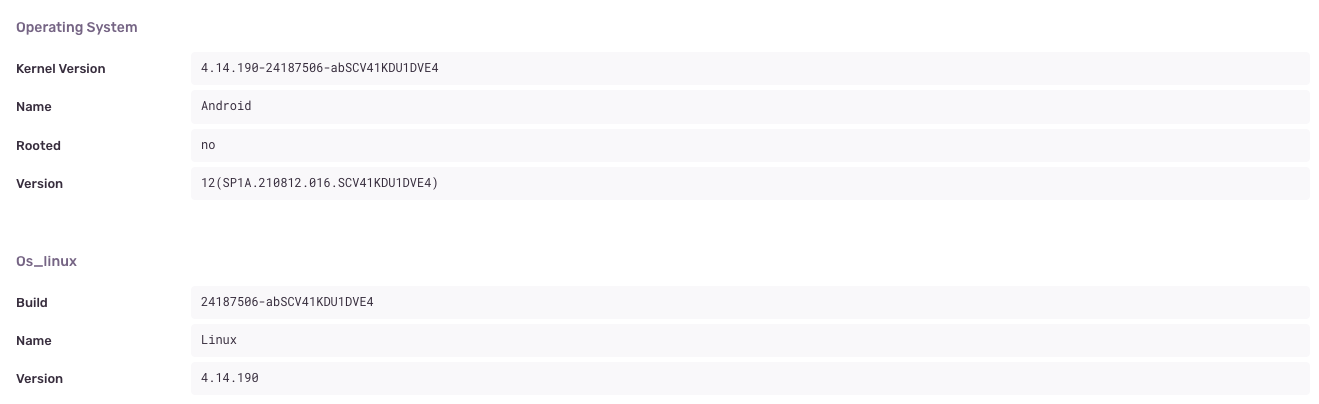
Build fingerprint: 'samsung/z3quew/z3q:12/SP1A.210812.016/G988U1UES3FVK1:user/release-keys'
#00 0x00000000005032e4 /data/app/~~VtVNBRifuJ04N56RIsWoRQ==/my.app.bundle.id--LnOREf5niSbPh06Kw3gXw==/base.apk!libjsc.so (BuildId: 9cb83e4124e3ee1471bc717c722b4109614385ba)
#01 0x0000000000000678 [vdso] (__kernel_rt_sigreturn+0)
#02 0x00000000000a30b8 /apex/com.android.runtime/lib64/bionic/libc.so (__epoll_pwait+8) (BuildId: b5d187ac75fe4580e13ab2ec624bf7f1)
#03 0x0000000000017ea8 /system/lib64/libutils.so (android::Looper::pollInner(int)+184) (BuildId: 748948a5650ad93d18b12eb1d9a51a89)
#04 0x0000000000017d84 /system/lib64/libutils.so (android::Looper::pollOnce(int, int*, int*, void**)+116) (BuildId: 748948a5650ad93d18b12eb1d9a51a89)
#05 0x0000000000159170 /system/lib64/libandroid_runtime.so (android::android_os_MessageQueue_nativePollOnce(_JNIEnv*, _jobject*, long, int)+48) (BuildId: 33b6cccb8cb818db0b8648d93b8de614)
#06 0x00000000003fe504 /data/misc/apexdata/com.android.art/dalvik-cache/arm64/boot.oat (art_jni_trampoline+116)
Crash dump is completed
Any updates on this, this is still happening as reported by our Sentry logs.
-We are using hermes in Expo SDK 47 -User simply starts the app and it crashes on the Splash screen.
