valgrind-false-positive
 valgrind-false-positive copied to clipboard
A deep investigation into a valgrind false-positive that took me like 15 hours to figure out.
valgrind-false-positive
tl;dr: A deep investigation into a Valgrind false-positive leading to a fix.
Intro
I maintain pcb2gcode, which is a program that I took over from the original authors a long time ago. It takes a gerber file, which is a normal way to save a PCB design, and converts it into milling instructions for your 3D printer or CNC milling machine.
3 days ago a PR failed testing with an error from Valgrind. The error says:
==28297== Conditional jump or move depends on uninitialised value(s)
That means that Valgrind has detected that I tried to use a value for a branch. Like if I had written this:
int x; // Left uninitialized
if (x > 5) { do_it(); }
Valgrind thinks that I did something like that so it's letting me know that my program will have unpredictable behavior. So I went back to my most previous successful CI run and:

It failed.

It only failed with clang.
My CI grabs Valgrind from sources at the head of the master branch (which is probably a bad idea). The CI caches it so I figured that maybe the cache expired, I got a new version, and then Valgrind reported an error.
Nope. Old versions of Valgrind fail just as bad as new ones. What's worse, it doesn't fail on my computer, even when I use clang!
So if it's not the version of Valgrind, maybe it's the verson of clang? I luckily had the foresight to output the version number of most of my dependencies in my CI runs and sure enough, passing vs failing:


The ubuntu apt repository must have been updated and is now grabbing clang version 10. Luckily I'm able to install multiple versions of clang on my computer so I ran sudo apt-get install clang-10 and I was able to run my code with it and see a failure locally. In the Boost voronoi geometry library of all places. At least I could reproduce the issue now!
Suspects
- It seems like clang could be the problem. Maybe they broke something in the new version?
- It's possible that Valgrind was the issue. It could be that Valgrind is not able to handle clang's latest optimizations.
- libboost: I hadn't upgraded but maybe an optimization or improvement in Valgrind surfaced somthing new?
Spoiler warning
It's number 2.Boost hadn't caused me trouble before and clang is quite well-used so I started by investigating Valgrind. I searched the web for some bug report that mentioned "clang" and "boost" and "Valgrind" and I wanted it to be pretty new because it's only in clang-10 and after. I don't know if I found my bug but I found a bug that sounded similar. It's also clang only and not gcc and only with optimizations at -O2. And it had some sample code that is pretty short. Sweet! I tried it on my computer and confirmed that Valgrind only reports an error:
- with clang, not gcc
- clang version 10, not 9 nor 8 or 7
- only with optimizations at
-O2
Here's that code:
// clang -W -Wall -g -O2 Standalone.c && valgrind --track-origins=yes ./a.out

#include <signal.h>

int main()
{
    {
        struct sigaction act;
        if (sigaction(SIGTERM, 0, &act) < 0)
            return 1;
        if (sigaction(SIGTERM, 0, &act) < 0)
            return 1;
    }

    char pattern[] = "12345678 ";
    pattern[0] = '1';
    const unsigned long plen = strlen(pattern);

    size_t hs=0;
    size_t hp=0;
    for (size_t i = 0; i < plen; ++i)
        hp += pattern[i];

    volatile int j=0;
    if (hs==hp)
        j=1;

    return 0;
}
Lots of weird stuff about that bug:
- The error goes away if you don't call sigaction twice or more.
- The error goes away if you don't set the first byte in
patternto a1, even though it's already a1. - The error goes away if you make the
patternshorter. - The error goes away if you remove the
==comparison. - The error goes away if you replace plen with a constant 9, even though
plenis always equal to 9.

Digging into Valgrind
I started with looking into Valgrind's memcheck. I did a lot of reading of code and eventually the white paper, too.
How Valgrind works
First, I learned how Valgrind memcheck works: For every bit in memory and in registers in the CPU, Valgrind keeps track of whether or not that bit has a "defined" value. "Defined" means that the bit was set by the program. For example, if you declare a variable, all the bytes in that variable are marked undefined. After you assign a value to it, those bits get marked defined. (Another thing that Valgrind keeps track of, per byte in memory, is whether or not it is "accessible", that is, you didn't walk off the end of your array. That part isn't pertinent for this bug.)
Valgrind stores all of this in the "shadow" memory. Knowing that most memory is never accessed and knowing that most bytes are either enitrely defined or entirely undefined, Valgrind has all sorts of tricks to store the shadow memory.
Valgrind can also compute the definedness of variables based on that of other variables:
int a = b + c;
a is defined if both b and c are defined. But if either of them is unknown, like maybe you forgot to initialize b, then so is a. The definedness equation of that one might be:
defined_a = defined_b && defined_c;
Some definedness equations can be trickier! For example, if you shift a variable 5 bits to the left, the definedness of the bits also shitft to the left and the lower five bits become defined, they are 0s.
int x;
x <<= 5;
// The rightmost 5 bits are defined (they are zero).
Even in the addition example above: If you know some of the lower bits then the lower bits are defined, even if you don't know the upper ones.
So Valgrind memcheck just needs to disassemble your program and run it one instruction at a time while maintaining the shadow. Everytime you hit a branch, check if the direction of the branch depends on undefined bits. That would be incredibly slow. Instead, Valgrind just-in-time replaces your instructions with new instructions that will both do the original work and also update the shadow or check it as needed. Memcheck is the plugin to Valgrind that determines how to instrument the code. Valgrind is the part that disassembles and re-assembles the code.
Back to debugging
I used a lot of printf in Valgrind to try to figure out what's going on and it was mostly a waste of time.
A good tool was putting the code in godbolt and looking at the assembly. What I did learn was this: Some of the modificatons to the code, like using a constant intead of strlen() or not modifying the string before processing it caused clang's super-smart optimizer to remove all the code and compute the answer at compile-time. I guess that was expected.
I also stepped through the code in gdb and found some more interesting stuff: If the string is fewer than 9 bytes, it will not enter the highly optimized loop and instead just do some specialized step for strings of length 8 or fewer. So the problem must be in the loop.
I still didn't know why calling sigaction twice or more makes a difference.
Eventually I returned to the docs and found the guide on using gdb with valgrind. There are a few options there but but the most important one is that you must run it like this:
valgrind --vgdb=full --vgdb-error=0 --vgdb-shadow-registers=yes --error-exitcode=127 YOUR_PROGRAM
--vgdb=fullis like turning off optimizations. Valgrind will run slower but the "definedness" of variables will stay in lock-step with your breakpoints, which is much more useful for reading out the values.--vgdb-error=0will cause it to halt as soon as starts up, so that you can set a breakpoint. It'll also print out some instructions on how to usegdb.--vgdb-shadow-registers=yeswill let you inspect not just the shadow memory for definedness but also the definedness of the registers. Crucial.
Then follow the instructions to startup gdb and connect. Because you're going to be debugging the assembly, it's useful to run layout asm in gdb so that you can see what instruction you are on.
Stepping through the code
The problematic loop which just adds up characters in the string is only for strings with more than 8 characters because it has a complex optimization in it: It uses x86's SIMD registers, xmm0 through xmm4, to add up all the bytes with less looping. I assume that the clang people did the measurements and figured out that this complex code is faster than a much shorter and simpler routine that does a lot more branching.
I compiled the code both with and without the second call to sigaction and ran it with vgdb. What I discovered was that the second call to sigaction was causing more of those xmm SIMD registers to be marked as undefined by valgrind. Why? Well, stepping through the sigaction code with vgdb turned up some small usage of xmm registers in sigaction. That usage loaded into xmm registers from memory. I don't know what it did with it but the first time around, it read memory that had been previously set in the stack. And the second time around, some of what it read up was junk values. Although each time the reading into xmm was done from the same place in memory, the first time read it while it was defined and the second time didn't. I don't know how those values got marked undefined but it was only on the second go. Maybe due to some write that saved registers to the stack that weren't defined in the first place?
Aha, a bug!
No, not a bug. Just having garbage in your registers isn't dangerous. After all, when you allocate an array, it starts with garbage. Even reading it is okay. Only when your code depends on it for observable output, for example, a branch. I also read up on the x86 calling conventions. Turns out a function is allowed to foul your xmm registers. Programs must not rely on xmm registers being unchanged before and after a function call (aka caller-saved).
Anyway, the fouled information in the xmm registers was all zeros anyway because that part of the stack was always zeros in my testing. Maybe the clang optimization was faulty and Valgrind was right? One way to find out is to fill that xmm with garbage and see what happens. That's what I did with some assembly code.. And sure enough, clang was giving all sorts of wrong answers!
I found a bug in clang?!
No, not a bug.
I hopped on to the LLVM discord to ask if I'd found a bonafide clang bug. I hadn't. Once you start mucking with assembly instructions in your code improperly, you are liable to confuse the compiler. I didn't mark my function as reserving any of those xmm registers so it happily inlined my code and I got all sorts of chaos. Back to the drawing board!
I figured that if I can fill the stack with garbage instead of zeros, then sigaction might read garbage instead of zeros into the xmm registers. Then the routine would continue onward and eventually screw up the answer without assembly code. I needed a way to add a bunch of junk on the stack and it had to be something that the compiler wouldn't optimize away. Maybe this isn't the shortest way to do it but here's what I came up with:
#define STACK_FILL_SIZE 500

int foo() {
  float stack_filler[STACK_FILL_SIZE];
  for (int i = 0; i < STACK_FILL_SIZE; i++) {
    // Just putting some of my favorite number into the stack for safe keeping.
    stack_filler[i] = cos(((double)(i)) + 0.1); // Never 0 I think.
  }
  float best = 0;
  for (int i = 0; i < STACK_FILL_SIZE; i++) {
    if (stack_filler[i] * 100 > best) {
      best = stack_filler[i];
    }
  }
  return ((int)best);
}
When you call it, the stack will stretch itself out to fit those 500 floats. Then it will retract itself back when it returns from the function. And after that, sigaction will have a garbage pile from which to read into xmm. And the computation is complex enough that the optimizer won't be able to get rid of it. Just in case, I put it in a different c file and linked them together.
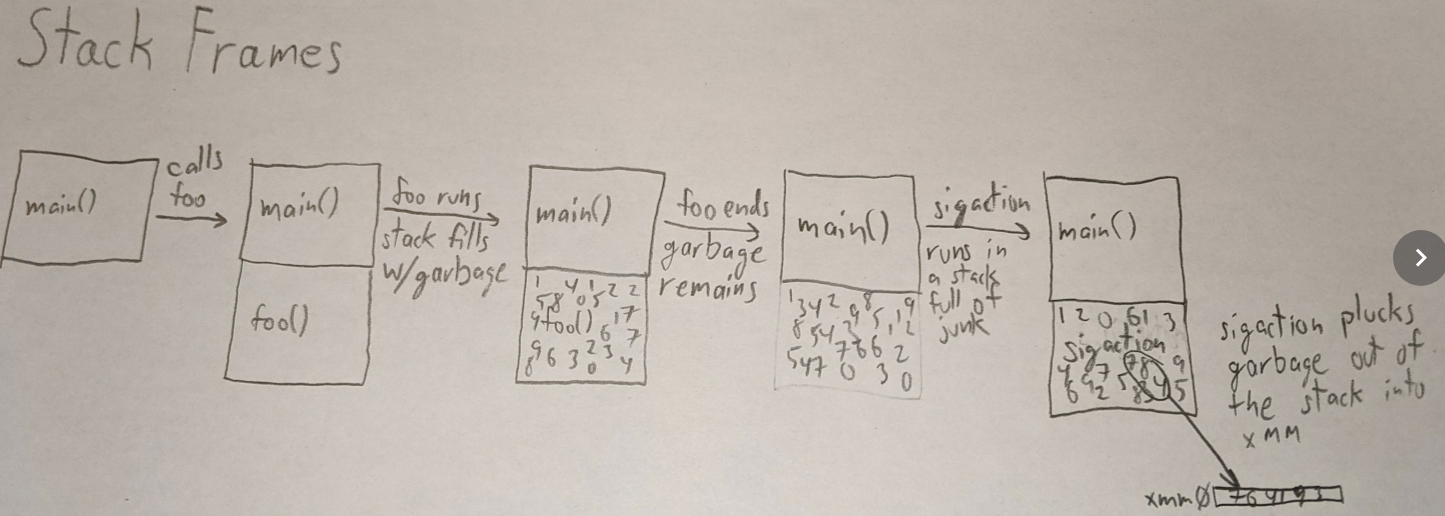
It worked! xmm registers were full of seemingly random data when the loop started. But, the output was still correct. Valgrind was still complaining about computation based on undefined values and the xmm register was filled with random-looking bits yet still the answer was right.
My final attempt
Now I was back to thinking that Valgrind is the problem. clang was always giving the right answer so it could hardly be blamed!
I started to read the assembly code that clang generates to optimize the loop. What it's doing is putting characters from the string into the SIMD registers and doing math on those registers so that some of the additions can happen in parallel. I stepped through the code with vgdb looking for the spot where an xmm register's "undecidedness" taints the rest of the calculation. Most of the xmm registers get decidedness during the 40-ish lines of asm except for xmm3. The undecidedness of that register spreads its undecidedness on all the other registers until the Valgrind complaint. I narrowed it down to these lines of assembly code:
<main+229>     movd   %edx,%xmm2              (1)
<main+233>     punpcklbw %xmm2,%xmm2          (2)
<main+237>     punpcklwd %xmm2,%xmm3          (3)
<main+241>     movzwl 0xa(%rsp,%rsi,1),%edx
<main+246>     movd   %edx,%xmm2              (4)
<main+250>     punpcklbw %xmm2,%xmm2
<main+254>     punpcklwd %xmm2,%xmm2
<main+258>     pxor   %xmm4,%xmm4             (5)
<main+262>     pcmpgtd %xmm3,%xmm4            (6)
<main+266>     psrad  $0x18,%xmm3
For the explanation of the code above, we'll use:
- small letters (abcdqrst) for known bytes,
- X for undefined garbage bytes, and
- 0 for defined 0 bytes. One letter per byte.
Steps explained:
- Putting a known value into xmm2. movd is double-word, 4-bytes, so xmm2 is now well-defined:
abcd0000000000000000 - Byte-wise interleaving the value in xmm2 with itself. So
xmm2is nowaabbccdd00000000.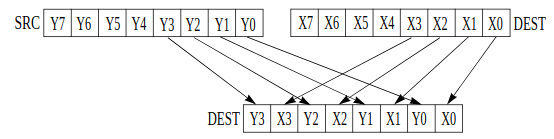
- Word-wise (16b) interleaving
xmm2withxmm3. Remember thatxmm3starts totally undefined soxmm3is nowaaXXbbXXccXXddXX. - Ignore for now, just notice that it clobbers whatever value was in
xmm2. - Sets
xmm4to all 0:0000000000000000
Step (6) is the tricky one. It's doing a signed, double-word (32-bit) SIMD comparison of xmm3 and xmm4 and putting the result as a 0 or -1 into xmm4. It works like this: Chop up the bits into 32-bit numbers. If the xmm4 number is bigger than the xmm3 number, the xmm4 position will be filled with ones. Otherwise, zeros. So the 4 comparisons look like this (MSB-first):
0000 > aaXX ? -1 : 0
0000 > bbXX ? -1 : 0
0000 > ccXX ? -1 : 0
0000 > ddXX ? -1 : 0
Or written another way:
aaXX < 0 ? -1 : 0
bbXX < 0 ? -1 : 0
ccXX < 0 ? -1 : 0
ddXX < 0 ? -1 : 0
That's just a check to see if the number on the left is negative. And to know if a number is negative in 2's-complement, you only need to know the first bit of it. And we do know the first bit. So the answer is actually fully defined. clang has no bug! So why is Valgrind complaining?
It's because Valgrind doesn't know about zeros. Remember, it only knows defined and undefined. So for Valgrind, it sees 4 comparisons like these:
aaXX < qrst ? -1 : 0
It's no longer enough to look at just the first bit because what if aa is the same as qr? You'll have to look at those Xs to figure out the answer and so the undefinedness taints the comparison and xmm4 is not considered defined. That undefinedness eventually makes its way to the if statement and valgrind complains.
A fix
Remember above in step (4) where the value in xmm2 is so quickly discarded? Why use xmm2 anyway? Why not just use xmm3 for the whole thing? It turns out that the rest of the code does that way:
<main+246>     movd   %edx,%xmm2
<main+250>     punpcklbw %xmm2,%xmm2
<main+254>     punpcklwd %xmm2,%xmm2

<main+305>     movd   %edx,%xmm0
<main+309>     punpcklbw %xmm0,%xmm0
<main+313>     punpcklwd %xmm0,%xmm0

<main+322>     movd   %edx,%xmm1
<main+326>     punpcklbw %xmm1,%xmm1
<main+330>     punpcklwd %xmm1,%xmm1
How do I convince the compiler to use xmm3 for the whole time? I don't. I just modify the program. Following these instructions, I wrote this little snippet:
void asm_test() {
  // what I have
  __asm__ ("movd %edx, %xmm2");
  __asm__ ("punpcklbw %xmm2, %xmm2");
  __asm__ ("punpcklwd %xmm2, %xmm3");

  // what I want
  __asm__ ("movd %edx, %xmm3");
  __asm__ ("punpcklbw %xmm3, %xmm3");
  __asm__ ("punpcklwd %xmm3, %xmm3");
}
I compiled it, and then ran objdump -D on it and got this:
  401697:       66 0f 6e d2             movd   %edx,%xmm2
  40169b:       66 0f 60 d2             punpcklbw %xmm2,%xmm2
  40169f:       66 0f 61 da             punpcklwd %xmm2,%xmm3
  4016a3:       66 0f 6e da             movd   %edx,%xmm3
  4016a7:       66 0f 60 db             punpcklbw %xmm3,%xmm3
  4016ab:       66 0f 61 db             punpcklwd %xmm3,%xmm3
Then I opened up my editor (emacs in hexl-mode) and carefully modified the binary. Where it looked like the former, I made it look like the latter. I looked at the diff of the objdump of each binary and it looked right. I ran it through Valgrind and...
==11693== ERROR SUMMARY: 0 errors from 0 contexts (suppressed: 0 from 0)
Great success.
Next step: Fix clang?
I wanted to find out where in LLVM's clang code the generation for that optimization exists and impose on it some requirement that the registers for the movd/punpcklbw/punpcklwd sequence must all be the same xmm register. There could be concerns with that:
- I don't see how there could be any danger in clobbering an xmm register that we're about to clobber anyway. But maybe there's some reason.
- There might be a delay. A delay is when the CPU is designed such that if you call a certain sequence of instructions, it will put everything on hold. For example, if you read from memory and then try to use it immediately, maybe your CPU will pause until the read is done. Better to interleave something else.
- There might be a hazard. A hazard is like a delay except that instead of putting the CPU on pause, you simply get undefined behavior if you don't wait long enough.
I got on the LLVM discord and email lists and asked. There was an easy solution, but it caused less performant code from clang. That's not acceptable. Anyway, clang shouldn't have to be fixing Valgrind.
Fix Valgrind
Valgrind disassembles your code, re-assembles it into new code that also tracks definedness, and then runs it. The check for SIMD 4-way greater-than was to just check each of the 4 numbers in the 128 bit registers for definedness and if any part of a comparison is undefined then so is all the output. For example:
Compare XXXX  0000  44XX  1234
with    0000  1234  0000  XXXX

results in:
        undef def   undef undef
But we could be doing better. For that third value, anything that starts with a 4 is sure to be bigger than 0000. All that we need to do is tell Valgrind about it.
After disassembly, Valgrind has access to both the value and the definedness of each bit. What if we make the definedness check a little smarter? For a value that is part knowns (0 and 1 bits) and part unknowns (X bits), we can compute the maximum and minimum possible value that it could have. We can compare the minimum of one with the maximum of the other and if there's no overlap then we know the answer despite the unknowns. And vice-versa. Only when their ranges overlap is there uncertainty.
bool isGreaterThanDefined(int xx, int yy, // the current values
                          int vxx, int vyy) { // the Xs, where 1 means undefined and 0 means defined
  auto not_vxx = ~vxx;
  auto not_vyy = ~vyy;
  auto min_xx = xx & not_vxx;
  auto min_yy = yy & not_vyy;
  auto max_xx = xx | vxx;
  auto max_yy = yy | vyy;
  if (min_xx > max_yy) {
    return true; // Whatever xx is, it'll be greater than yy.
  } else if (!(max_xx > min_yy)) {
    return true; // Whatever xx is, it'll never be greater than yy.
  } else {
    return false; // There is uncertainty.
  }
}
This code doesn't work. The problem is that replacing all Xs with 1s doesn't always make a signed integer number bigger because in the MSB, the sign bit is 0 for positive and 1 for negative. So we need to flip the MSBs before we compute the max and min and then flip them back.
bool isGreaterThanDefined(int xx, int yy, // the current values
                          int vxx, int vyy) { // the Xs, where 1 means undefined and 0 means defined
  xx ^= MIN_INT;
  yy ^= MIN_INT;
  auto not_vxx = ~vxx;
  auto not_vyy = ~vyy;
  auto min_xx = xx & not_vxx;
  auto min_yy = yy & not_vyy;
  auto max_xx = xx | vxx;
  auto max_yy = yy | vyy;
  xx ^= MIN_INT;
  yy ^= MIN_INT;
  if (min_xx > max_yy) {
    return true; // Whatever xx is, it'll be greater than yy.
  } else if (!(max_xx > min_yy)) {
    return true; // Whatever xx is, it'll never be greater than yy.
  } else {
    return false; // There is uncertainty.
  }
}
All done! The actual patch looks different because it's written in VEX so that Valgrind can insert it into your code as instrumentation.