[Enhancement] Network graph scale
Issue
Current network graphs download and upload graphs have 2 different auto-scales
Current behavior:
Looking just at this graph it looks like upload and download speeds are the same:
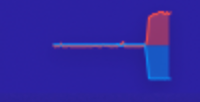
But if you look at the actual values, the download speed is a lot higher than the upload:
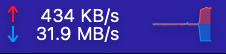
So in my opinion current network graph is misleading because download and upload are shown together but they don't relate to each other
Expected behavior:
Here is same scenario in default macOS Activity Monitor, network tab:
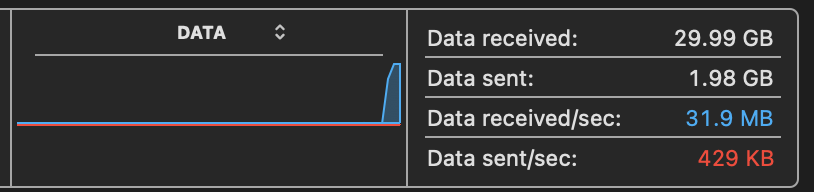 It also has auto-scale based on peak traffic but you can clearly see that the download speed spike is a lot higher compared to the upload, just by looking at the graph
Suggested solutions
- Manual settings to configure graph scale (see in related issue: https://github.com/exelban/stats/issues/844)
- Have 1 peak for download and upload (match auto-scale as in Activity Monitor)
- Show peak values or scales near the graph
Hi. Thanks for your feedback. I have never had a problem with that, but I understand it. I will think of how it could be solved.
I came here to point out the exact same issue!
For me the best solution would be a fixed scale, that is set to the maximum speeds that the current network connection supports.
This seems to be an option in MenuMeters as shown here: https://github.com/exelban/stats/issues/844#issuecomment-1059786307
"Display Scale to: Interface speed"
I understand this means most traffic will be almost invisible on the graph, but for me this is fine. I am only interested in seeing unexpectedly high usage.
Could the enabling this wind up completely shrinking the smaller value to not really be visible? I think that would be less desirable.