go-ethereum
 go-ethereum copied to clipboard
eth/filters: add global block logs cache
This adds a cache for block logs which is shared by all filters. In order to share the cache reference, filters now need to be created through a 'filter system' object. Cache size is user-configurable via --cache.logcache.
This PR is an alternative to https://github.com/ethereum/go-ethereum/pull/25425. cc @ryanschneider
Fixes https://github.com/ethereum/go-ethereum/issues/25421 Includes #25468, which should be merged first.
This is ready for testing now. The cache size is configurable via --cache.logcache or in TOML with Eth.FilterLogCacheSize = 128, for example.
@holiman Please re-check this, the PR has changed significantly after your initial review.
@s1na are the cli flag ergonomics the only thing holding up this PR from being accepted now? It'd be great to get this in the next release for the Merge! Looks like one more codeowner ✅ is required.
@fjl not yet, but I did list the steps to test the performance regression in https://github.com/ethereum/go-ethereum/issues/25421 so anyone else can as well.
@s1na wow great job!
$ /tmp/hey-linux-amd64 -c 5 -z 40s -t 0 -m POST -T application/json -d '{"jsonrpc":"2.0", "id": 1123123, "method": "eth_getLogs", "params": [{}]}' http://0.0.0.0:8545/

Summary:
  Total:	40.0023 secs
  Slowest:	0.0429 secs
  Fastest:	0.0011 secs
  Average:	0.0027 secs
  Requests/sec:	1852.4451


Response time histogram:
  0.001 [1]	|
  0.005 [67507]	|■■■■■■■■■■■■■■■■■■■■■■■■■■■■■■■■■■■■■■■■
  0.009 [592]	|
  0.014 [3885]	|■■
  0.018 [1881]	|■
  0.022 [192]	|
  0.026 [21]	|
  0.030 [10]	|
  0.035 [7]	|
  0.039 [3]	|
  0.043 [3]	|


Latency distribution:
  10% in 0.0014 secs
  25% in 0.0015 secs
  50% in 0.0017 secs
  75% in 0.0020 secs
  90% in 0.0030 secs
  95% in 0.0117 secs
  99% in 0.0153 secs

Details (average, fastest, slowest):
  DNS+dialup:	0.0000 secs, 0.0011 secs, 0.0429 secs
  DNS-lookup:	0.0000 secs, 0.0000 secs, 0.0000 secs
  req write:	0.0000 secs, 0.0000 secs, 0.0047 secs
  resp wait:	0.0023 secs, 0.0009 secs, 0.0405 secs
  resp read:	0.0004 secs, 0.0001 secs, 0.0170 secs

Status code distribution:
  [200]	74102 responses
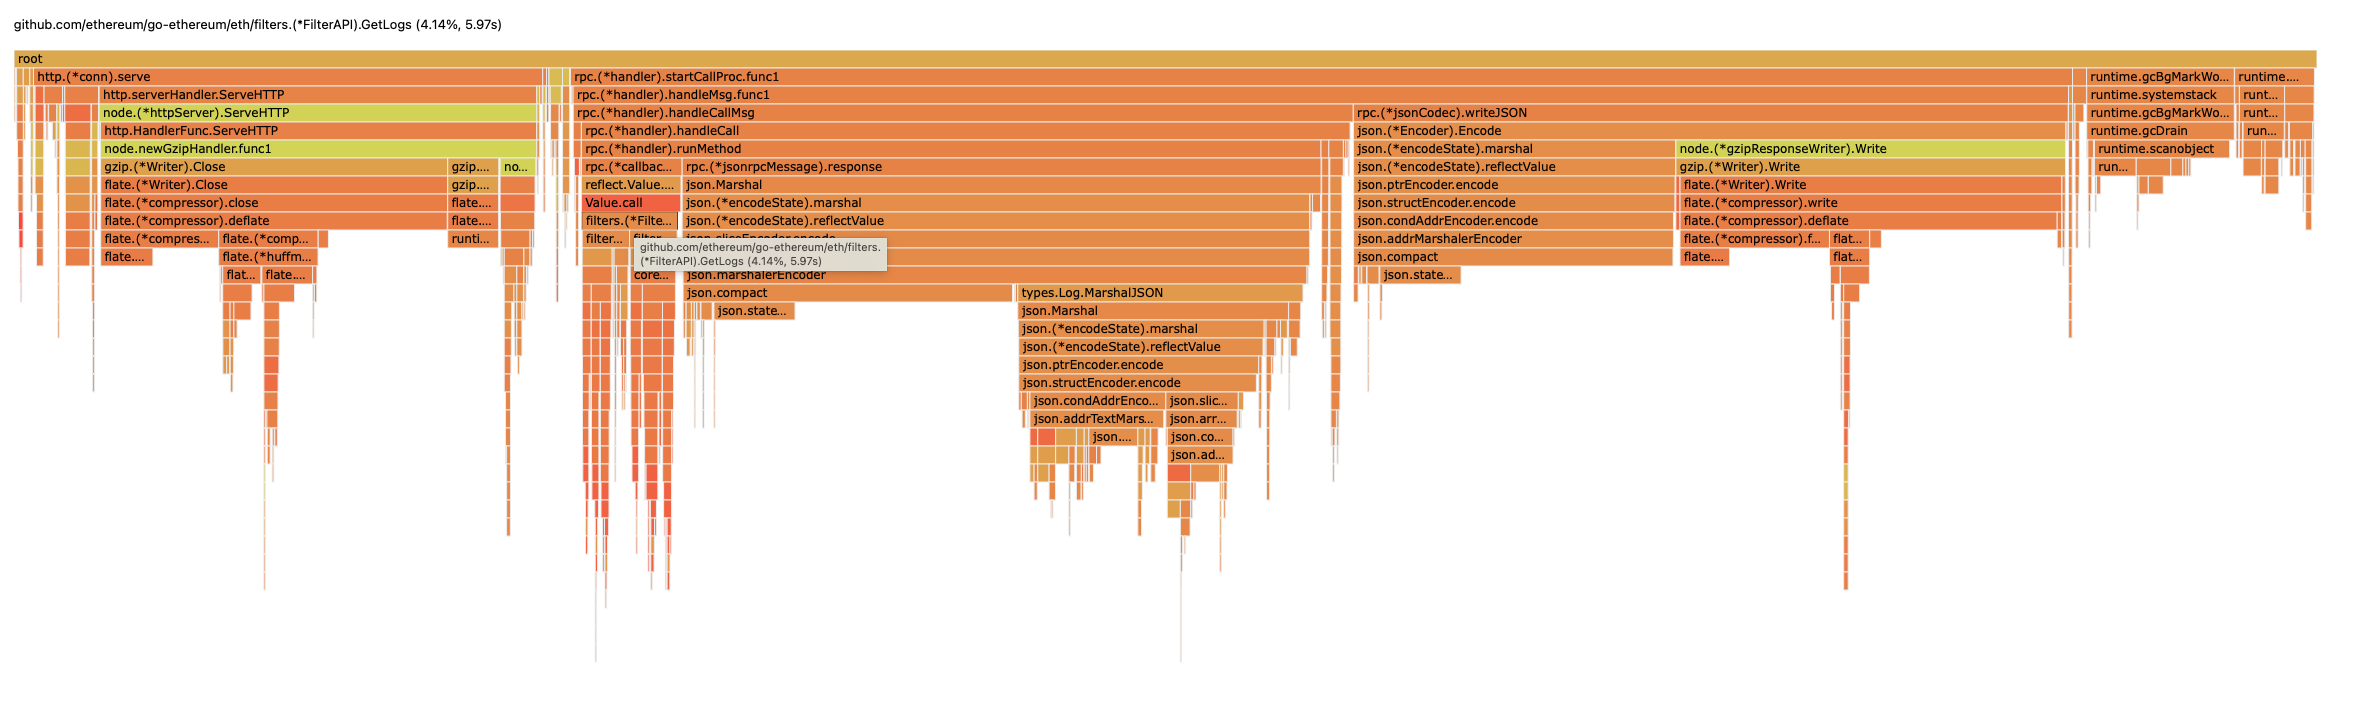
Very little of the CPU flame graph was spent in GetLogs at all now: