erigon polygon network unusual approach, weird reply data size and slow reply
System information
Erigon version: 2022.07.2-alpha-c7a94eee
OS & Version: Linux
Commit hash :
/usr/local/bin/erigon --datadir=/node/full/polygon-erigon/ --chain=bor-mainnet --prune=hrtc --bor.heimdall=${heimdallAddr} --port=31290 --private.api.addr=127.0.0.1:31293 --torrent.port=31294 --http=false --db.read.concurrency 2000 --rpc.batch.concurrency 10000
/usr/local/bin/rpcdaemon --datadir=/node/full/polygon-erigon/ --private.api.addr=localhost:31293 --http.api 'eth,erigon,web3,net,debug,trace,txpool,db,starknet,bor' --http.addr 0.0.0.0 --http.port 31291 --http.vhosts '*' --http.corsdomain '*' --ws --db.read.concurrency 2000 --rpc.batch.concurrency 80000
Expected behaviour
json rpc request method eth_getBlockByNumber
Use methods to request data, return data in seconds, and support a considerable amount of concurrency
Actual behaviour
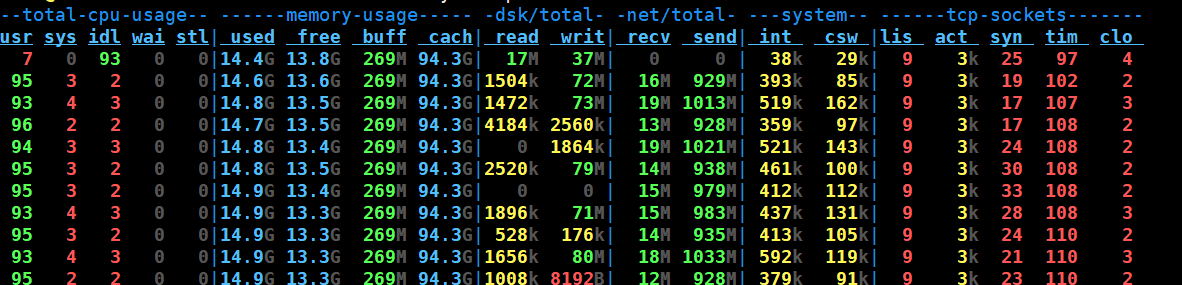
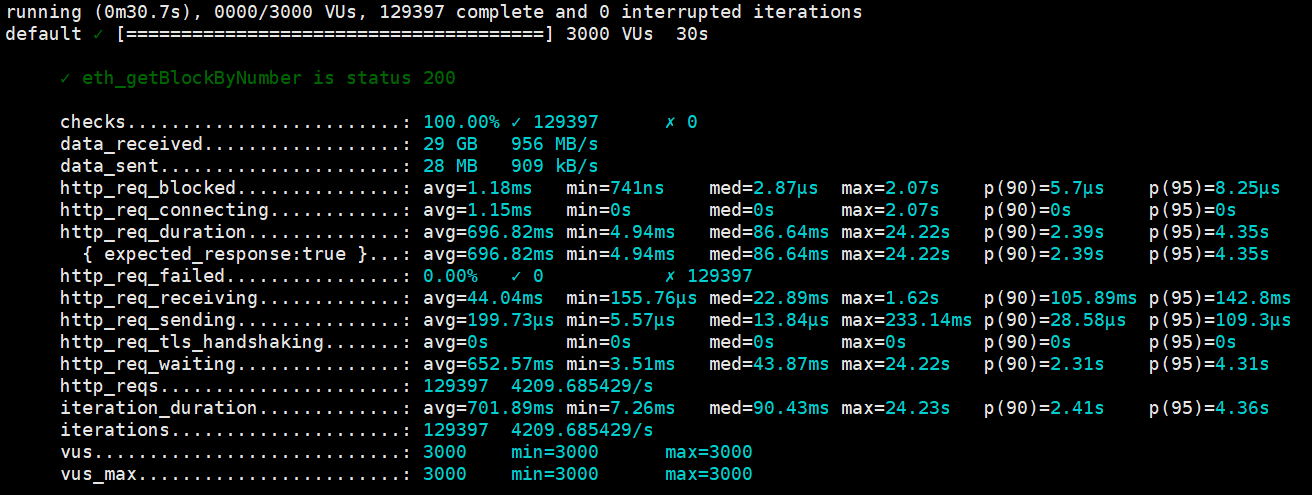
Tested on the same server, bor concurrency is 60k/reqs per second , but erigon is only 9k/reqs under this method, and the return time is very long bor: k6: 60k/reqs net upload speed: 20M/s erigon k6: 9s/reqs net upload speed: 900M/s
The network used here is very strange. According to the block data size and request rate, this large body will not be returned to the requester.

Steps to reproduce the behaviour
Use the k6 load tool to run the following script, you need to modify the IP and block height in the script
Backtrace
[backtrace]
- do you request historical blocks or recent blocks?
- try reduce --db.read.concurrency to default value
- try add --pprof flag to rpcdaemon, start load test, and show us result of
go tool pprof -png http://127.0.0.1:6060/debug/pprof/profile\?seconds\=20 > cpu.png - "bor concurrency is 60k/reqs per second" - what is "bor concurrency"?
This issue is stale because it has been open for 40 days with no activity. Remove stale label or comment, or this will be closed in 7 days.
This issue was closed because it has been stalled for 7 days with no activity.