ember-api-docs
 ember-api-docs copied to clipboard
Frequent Invalid Response errors seen in LogEntries for API App
Over the last few weeks the api application in heroku has been experience higher than normal response times and higher than normal memory usage.
When looking at looks I see frequent and consistent application errors as follows. We should clean these errors up. Unsure if the errors and the load are correlated at this point but these are worth cleaning up. We haven't heard anything from users of the application concerning these.
From LogEntries:
13 Jan 2019 10:13:53.831409 <158>1 2019-01-13T15:13:53.336566+00:00 heroku router - - at=info method=GET path="/ember/2.16/namespaces/Ember.String/methods/htmlSafe?anchor=htmlSafe" host=ember-api-docs.herokuapp.com request_id=3b57b253-6b3b-4077-b78e-46c0795cad64 fwd="66.249.64.31, 54.224.194.227, 157.52.99.51,157.52.79.44" dyno=web.1 connect=0ms service=423ms status=307 bytes=342 protocol=https
Heroku/Syslog drain
13 Jan 2019 10:13:53.977431 <158>1 2019-01-13T15:13:53.248446+00:00 heroku router - - at=info method=GET path="/ember/2.15/classes/Ember.CoreView/methods/decrementProperty?anchor=decrementProperty" host=ember-api-docs.herokuapp.com request_id=e2f6706c-4628-449b-8f8f-97d8b23e01df fwd="54.36.148.181, 54.224.194.227, 157.52.99.35,157.52.79.38" dyno=web.1 connect=0ms service=1233ms status=200 bytes=314001 protocol=https
Heroku/Syslog drain
13 Jan 2019 10:13:57.875280 <190>1 2019-01-13T15:13:53.226937+00:00 app web.1 - - { FetchError: invalid json response body at https://ember-api-docs.global.ssl.fastly.net/json-docs/ember/2.16.4/namespaces/undefined.json reason: Unexpected token < in JSON at position 0
    at /app/tmp/deploy-dist/node_modules/node-fetch/lib/index.js:247:32
    at process.internalTickCallback (internal/process/next_tick.js:77:7)
Heroku/Syslog drain
13 Jan 2019 10:13:57.875104 <190>1 2019-01-13T15:13:53.226953+00:00 app web.1 - - message:
Heroku/Syslog drain
13 Jan 2019 10:13:57.875272 <190>1 2019-01-13T15:13:53.226954+00:00 app web.1 - - 'invalid json response body at https://ember-api-docs.global.ssl.fastly.net/json-docs/ember/2.16.4/namespaces/undefined.json reason: Unexpected token < in JSON at position 0',
Heroku/Syslog drain
13 Jan 2019 10:13:57.875178 <190>1 2019-01-13T15:13:53.226957+00:00 app web.1 - - type: 'invalid-json' } 'fetching by class or module failed, retrying as namespace'
Heroku/Syslog drain
13 Jan 2019 10:13:57.875211 <190>1 2019-01-13T15:13:53.237442+00:00 app web.1 - - 2019-01-13T15:13:53.237Z 200 OK /ember/2.15/classes/Ember.CoreView/methods/decrementProperty?anchor=decrementProperty
Heroku/Syslog drain
13 Jan 2019 10:13:57.875280 <190>1 2019-01-13T15:13:53.277606+00:00 app web.1 - - { FetchError: invalid json response body at https://ember-api-docs.global.ssl.fastly.net/json-docs/ember/2.16.4/namespaces/undefined.json reason: Unexpected token < in JSON at position 0
    at /app/tmp/deploy-dist/node_modules/node-fetch/lib/index.js:247:32
    at process.internalTickCallback (internal/process/next_tick.js:77:7)
Heroku/Syslog drain
13 Jan 2019 10:13:57.875104 <190>1 2019-01-13T15:13:53.277614+00:00 app web.1 - - message:
Heroku/Syslog drain
13 Jan 2019 10:13:57.875272 <190>1 2019-01-13T15:13:53.277616+00:00 app web.1 - - 'invalid json response body at https://ember-api-docs.global.ssl.fastly.net/json-docs/ember/2.16.4/namespaces/undefined.json reason: Unexpected token < in JSON at position 0',
Heroku/Syslog drain
13 Jan 2019 10:13:57.875118 <190>1 2019-01-13T15:13:53.277618+00:00 app web.1 - - type: 'invalid-json' }
Heroku/Syslog drain
13 Jan 2019 10:13:57.875194 <190>1 2019-01-13T15:13:53.335097+00:00 app web.1 - - 2019-01-13T15:13:53.334Z 307 OK /ember/2.16/namespaces/Ember.String/methods/htmlSafe?anchor=htmlSafe
Heroku/Syslog drain
I was able to spike the memory and response in heroku by doing about five bad requests sequentially on a preview app. So these bad requests are taking up a good chunk of memory. Memory does fall back, but these requests are very resource intensive, and would explain heroku's frequent memory quota exceeded errors. It also looks like there's a chunck of that memory that is not being freed up, which may point to a leak.
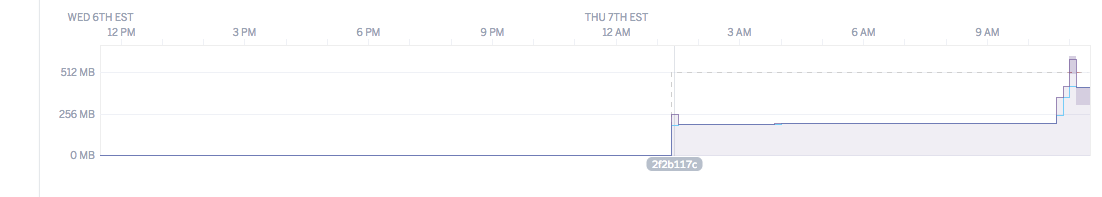
Will also try with non-failing requests to see if this memory pattern is unique to failures or also happens on successful requests.
successful requests also spike memory, but at a much lesser rate, and the performance doesn't degrade as with errors. I ran about 4 times the amount of successful requests as failed and saw no problem.
Memory leak debugging resources: https://github.com/ember-fastboot/fastboot/pull/100#issuecomment-275805511 https://github.com/ember-best-practices/memory-leak-examples
Also can supply destroyAppInstanceInMs to make the the instance shut down and not stick around after a request. https://github.com/ember-fastboot/fastboot#additional-configuration