dap-mode
 dap-mode copied to clipboard
Eval async code while debugging [Javascript]
If I have this code in a js file, put a breakpoint on the first line and try evaluating the second line with dap, I do not get a result on the stdout,
console.log("start debugging"); // breakpoint here
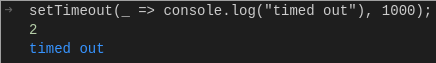
setTimeout(() => console.log("timed out"), 1000); // evaluate this region without getting a result on stdout
I assume the callback queue is blocked until the stack is cleared, which, while stopped at a breakpoint, never happens. In that case, we can only evaluate synchronous code, which reduces somewhat the utility of the debugger.
This feature does not work for me in Chrome nor in Node (both with dap-mode), nor in the Chrome console directly, but it does work in indium, so I assume it is possible.
Is this dap's fault, is it simply the JavaScript's way, is there a way around this, some extra arguments to give in the template, etc?
Or, maybe something similar to evaluating code while NOT stopped at a breakpoint, similar to chrome's behavior while evaluating code in the console?
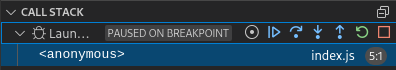
I've tried VS Code, eventually. While on a breakpoint, there is definitely no such functionality as evaluating async code as explained above, but there is this scenario:
- Put a breakpoint somewhere
- Run->Start Debugging
- Wait to stop on breakpoint
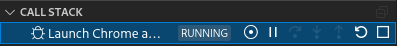
- Press Continue (F5)
- Now there is a running debugging session, similar to what you get in the chrome console,
- Now I can evaluate sync and async code in the console,
Back to emacs, in dap-mode, if I do the same steps which end with dap-continue (step 4 above), and try to evaluate something (step 6 above), I get dap--cur-active-session-or-die: Session Chrome Browse File is terminated. Meaning that in emacs' case there is a debug session only if we're stopped on a breakpoint.