Extreme GPU usage while Element app is visible
Steps to reproduce
- Install Element from .rpm or flathub.
- During Login no excess CPU usage is visible
- Login
- While the Element app is now visible an excessive CPU usage (full load on one core) as long as it's visible
- Minimize the Element app
- CPU usage of Element app drops back to 0%
- Open Element app back up.
- CPU usage of Element app raises to 100%
What happened?
Element app has a constant, very high CPU load which is noticable by running fans and the machine heating up.
What did you expect?
Element app should not show a noticeable CPU usage while it's idling on the desktop.
While Element app is visible:

While Element app is minimized the CPU load drops to 0%.
Operating system
Fedora 34 (GNOME 40.4 wayland, rpm and flathub tested) and ArchLinux (GNOME 40.5 Xorg, flathub tested)
Application version
reproduciable on 1.8.5 and 1.9.0
How did you install the app?
tested rpm and flathub, seperatly on a clean installation of Fedora and ArchLinux
Homeserver
matrix.org
Have you submitted a rageshake?
Yes
Would you be able to share a performance profile of the renderer process so that we can investigate this issue further.
Thank you for sharing a /rageshake, but unfortunately those logs do not contain the rigth information for this kind of problem.
You can do so by opening the developer console in the electron app and recording a performance profile
Would you be able to share a performance profile of the renderer process so that we can investigate this issue further. Thank you for sharing a
/rageshake, but unfortunately those logs do not contain the rigth information for this kind of problem.You can do so by opening the developer console in the electron app and recording a performance profile
Yep, will do. Recorded 20sec while Element app idles. htop confirmed the issue during the recording.
Performance profile: Profile-20211004T173606.zip
It appears that your CPU is fine, but something obliterates your GPU. I'm going to close this ticket as it appears to be a duplicate of vector-im/element-web#19217 which experiences the same problem as you.
Could you comment on there answering the questions that were asked
@gsouquet The issue seems related, but different as it happens in Firefox, not Chromium (which Element desktop is relied on). The other issue seems fixed when enabling WebRender.
@gsouquet, I think this manually needs to be moved out of Closed?
Tested again with latest version (1.9.1). The issue is still reproduciable.
If it helps the following lines are printed to console on startup. Is the libva line interesting?
[2 preload-host-spawn-strategy] Running: /app/bin/zypak-helper child - /app/Element/element-desktop --type=zygote
/var/home/mershl/.var/app/im.riot.Riot/config/Element exists: yes
/var/home/mershl/.var/app/im.riot.Riot/config/Riot exists: no
Gtk-Message: 18:01:41.671: Failed to load module "canberra-gtk-module"
Gtk-Message: 18:01:41.671: Failed to load module "canberra-gtk-module"
Starting auto update with base URL: https://packages.element.io/desktop/update/
Auto update not supported on this platform
Fetching translation json for locale: en_EN
Changing application language to en-us
Fetching translation json for locale: en-us
Could not fetch translation json for locale: 'en-us' Error: Cannot find module './i18n/strings/en-us.json'
Require stack:
- /app/Element/resources/app.asar/lib/language-helper.js
- /app/Element/resources/app.asar/lib/tray.js
- /app/Element/resources/app.asar/lib/electron-main.js
-
    at Module._resolveFilename (internal/modules/cjs/loader.js:887:15)
    at Function.n._resolveFilename (electron/js2c/browser_init.js:257:1128)
    at Module._load (internal/modules/cjs/loader.js:732:27)
    at Function.f._load (electron/js2c/asar_bundle.js:5:12913)
    at Module.require (internal/modules/cjs/loader.js:959:19)
    at require (internal/modules/cjs/helpers.js:88:18)
    at AppLocalization.fetchTranslationJson (/app/Element/resources/app.asar/lib/language-helper.js:76:20)
    at /app/Element/resources/app.asar/lib/language-helper.js:89:39
    at Array.forEach (<anonymous>)
    at AppLocalization.setAppLocale (/app/Element/resources/app.asar/lib/language-helper.js:88:17) {
  code: 'MODULE_NOT_FOUND',
  requireStack: [
    '/app/Element/resources/app.asar/lib/language-helper.js',
    '/app/Element/resources/app.asar/lib/tray.js',
    '/app/Element/resources/app.asar/lib/electron-main.js',
    undefined
  ]
}
Resetting the UI components after locale change
Resetting the UI components after locale change
libva error: vaGetDriverNameByIndex() failed with unknown libva error, driver_name = (null)
Changing application language to en-us
Fetching translation json for locale: en-us
Could not fetch translation json for locale: 'en-us' Error: Cannot find module './i18n/strings/en-us.json'
Require stack:
- /app/Element/resources/app.asar/lib/language-helper.js
- /app/Element/resources/app.asar/lib/tray.js
- /app/Element/resources/app.asar/lib/electron-main.js
-
    at Module._resolveFilename (internal/modules/cjs/loader.js:887:15)
    at Function.n._resolveFilename (electron/js2c/browser_init.js:257:1128)
    at Module._load (internal/modules/cjs/loader.js:732:27)
    at Function.f._load (electron/js2c/asar_bundle.js:5:12913)
    at Module.require (internal/modules/cjs/loader.js:959:19)
    at require (internal/modules/cjs/helpers.js:88:18)
    at AppLocalization.fetchTranslationJson (/app/Element/resources/app.asar/lib/language-helper.js:76:20)
    at /app/Element/resources/app.asar/lib/language-helper.js:89:39
    at Array.forEach (<anonymous>)
    at AppLocalization.setAppLocale (/app/Element/resources/app.asar/lib/language-helper.js:88:17) {
  code: 'MODULE_NOT_FOUND',
  requireStack: [
    '/app/Element/resources/app.asar/lib/language-helper.js',
    '/app/Element/resources/app.asar/lib/tray.js',
    '/app/Element/resources/app.asar/lib/electron-main.js',
    undefined
  ]
}
Resetting the UI components after locale change
Hi. Maybe I can add something to this (also running Element: 1.9.8):
On my systems the high load disappears after approx. 15 seconds but the other symptoms are the same.
When I launch with element-desktop --hidden there is no noticable load.
As soon as I make the window visible there is a considerable amount of cpu-load for more than 10 seconds with in the following processes (see [1]). The load occurs in the desktop app, in firefox and google-chrome regardless of hardware acceleration enabled or disabled. The load is not dependent on the selected chat and even a later switch to a chat with a lot of media does not trigger the symptoms again. Running on Debian Buster and tested on the following hardware:
Device-1: Intel HD Graphics 520 driver: i915 v: kernel
Display: x11 server: X.Org 1.20.4 driver: intel resolution: 1600x900~60Hz
OpenGL: renderer: Mesa DRI Intel HD Graphics 520 (Skylake GT2) v: 4.5 Mesa 18.3.6
Device-1: Intel Xeon E3-1200 v2/3rd Gen Core processor Graphics driver: i915 v: kernel
 x11 server: X.Org 1.20.4 driver: modesetting resolution: 1920x1080~60Hz
renderer: Mesa DRI Intel Ivybridge Desktop v: 4.2 Mesa 18.3.6
Device-1: Intel driver: i915 v: kernel
Display: x11 server: X.Org 1.20.4 driver: modesetting unloaded: fbdev,vesa
resolution: 1368x768~60Hz
OpenGL: renderer: Mesa DRI Intel HD Graphics 500 (Broxton 2x6)
v: 4.5 Mesa 18.3.6
The symptoms occur only in element, not on the many other websites I visit with firefox or google chrome.
It is always reproducible so please, what info can I provide in order to solve this? A shoot in the dark: I think something is loaded/polled for in the background with an unreasonably high loop-frequency.
[1]
tycho     4576 42.7  2.3 57053424 181532 pts/1 Sl+  12:07   0:07 /opt/Element/element-desktop --type=renderer --field-trial-handle=6416784470168092594,10345997723189300962,131072 --enable-features=WebRTCPipeWireCapturer --disable-features=CookiesWithoutSameSiteMustBeSecure,HardwareMediaKeyHandling,MediaSessionService,SameSiteByDefaultCookies,SpareRendererForSitePerProcess --lang=de --standard-schemes=vector --enable-sandbox --secure-schemes=vector --bypasscsp-schemes --cors-schemes --fetch-schemes=vector --service-worker-schemes --streaming-schemes --app-path=/opt/Element/resources/app.asar --num-raster-threads=2 --enable-main-frame-before-activation --renderer-client-id=4 --no-v8-untrusted-code-mitigations --shared-files=v8_context_snapshot_data:100

tycho     4553  8.1  1.0 358084 83624 pts/1    Sl+  12:07   0:01 /opt/Element/element-desktop --type=gpu-process --field-trial-handle=6416784470168092594,10345997723189300962,131072 --enable-features=WebRTCPipeWireCapturer --disable-features=CookiesWithoutSameSiteMustBeSecure,HardwareMediaKeyHandling,MediaSessionService,SameSiteByDefaultCookies,SpareRendererForSitePerProcess --gpu-preferences=UAAAAAAAAAAgAAAQAAAAAAAAAAAAAAAAAABgAAAAAAAwAAAAAAAAAAAAAAAAAAAAAAAAAAAAAAAgAAAAAAAAACAAAAAAAAAAAAAAAAAAAAAIAAAAAAAAAAgAAAAAAAAACAAAAAAAAAA= --shared-files
I was also experiencing the issue of constant high CPU use while the window is not minimized. In my case, it turned out to be caused by having an animated gif as my profile picture. Most UI elements do not show the animation, but the sidebar would play the animation and presumably do some CPU intensive blurring every frame.
My element causes between 50-80% cpu usage according to top, even though there are no visible changes in the GUI. I don't have an animated profile picture.
I'd love to help debugging this via performance profiles, but it seems those contain screenshots of the app. I don't know what else they might contain, so I'll not start with posting one now. I'd also recommend warning users about that when devs request them as users might not notice/know that they contain screenshots, thereby accidentally leaking private information.
Distro: opensuse tumbleweed Element version: 1.9.8 Olm version: 3.2.8
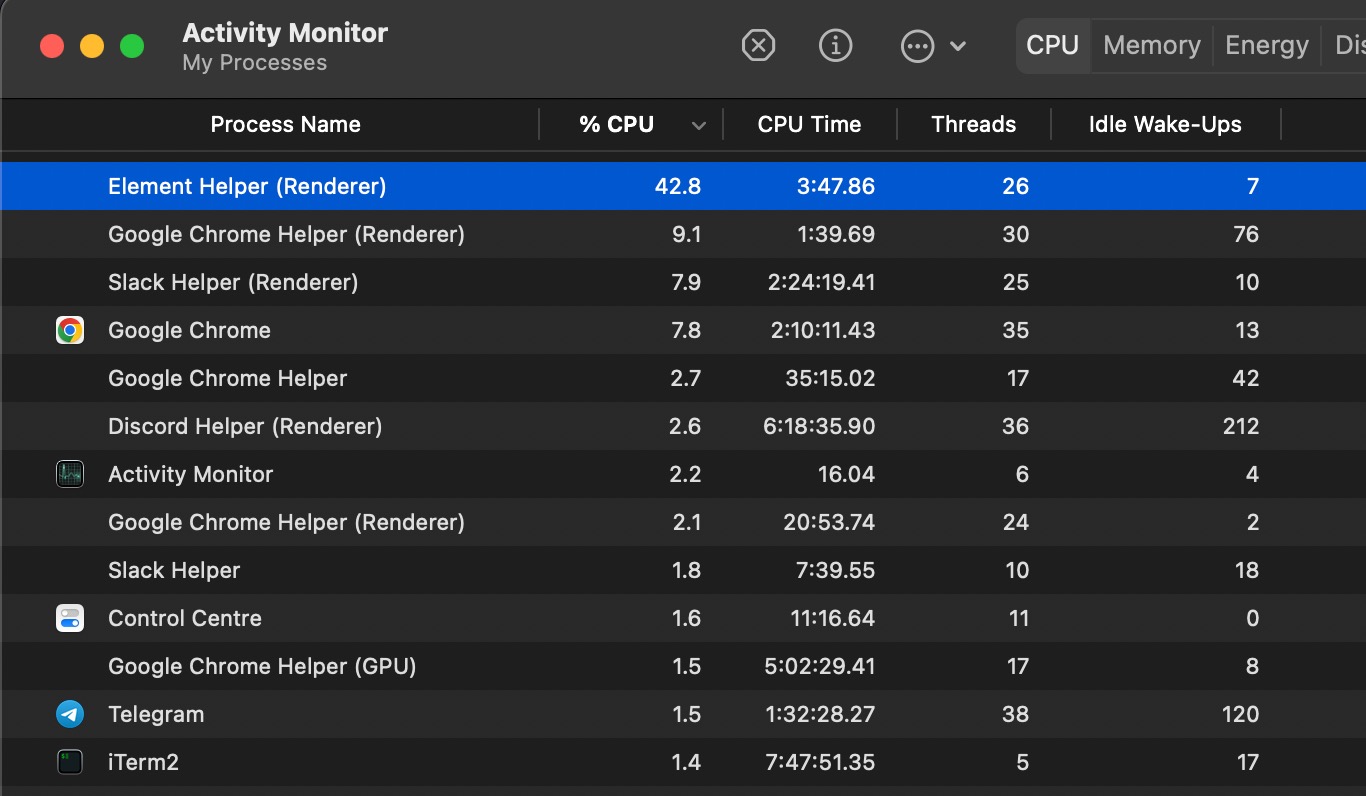
Can confirm high idle CPU usage on OSX (Monterey, 12.3.1). Element version 1.10.9 (1.10.9)
For me it appears to correlate to the number of messages in the backlog.
I can reproduce it like this:
-
Create a new, empty room
-
While the room is empty: <1% CPU
-
Type one message. Idle CPU raises to ~15%.
-
Every additional message adds around 2% to the idle CPU load until it plateaus at around 50%.
It sticks to this high idle load while Element window is visible, even when it's in the background. When hiding the window (with ⌘H) it drops to <1% and stays there.
I have no animated avatar. None of the toggles under Preferences
seems to affect it (CPU load remains unchanged when toggling them all to off).

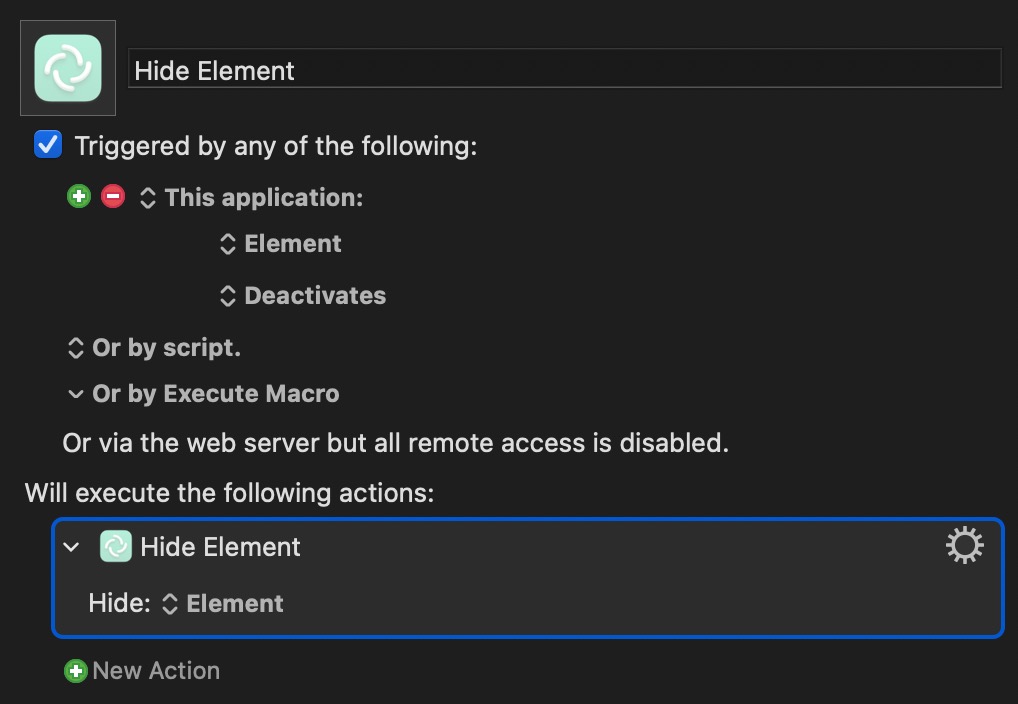
Fwiw, for anyone else who's affected by this on OSX, You can use this Keyboard Maestro macro to auto-hide Element whenever it goes out of focus:
🪄

I just updated to 1.10.9 on Ubuntu using apt and I now have this issue too. One core is constantly used 50-60% and it goes away if I close the window. No animations or anything moving in the window. I don't think I've had this before, or at least haven't had this for long, since I usually notice from the sound of fans if my computer isn't really idling.
I observed serious CPU usage from the "Element Helper (GPU)" (1.10.10) thread on apple silicon even when the app is only on background. It drains the battery. Here is a sample took on it https://sbarnea.com/ss/Sample-of-Element-Helper-GPU-.txt

@ssbarnea that is a different issue which is already fixed on develop.
After some time the excess CPU usage has gone down and isn't a problem for me anymore. I now run Element desktop 1.10.10. I don't really know what has changed other than that.
I have the same issue outlined here running Element Desktop 1.10.10 on nixOS 21.11 I can also confirm the same behaviour as outlined by m-o-e about the number of messages in the room. Displaying an empty room lets element drop CPU usage from 80-140% to less than 1% (taken from htop) In the past i've had to close element for taking too much CPU, it's crazy to me, that this issue even exists. I always thought it was an electron issue as electron apps are known to be badly optimized.
Is anyone working on this?
I just happen to stumble upon this issue and want to add to this in year 2025, since I do not have this issue on Ubuntu 24.04.2 LTS the App installed via Flatpak.
My readings in both the system monitor and intel_gpu_top are both relatively normal for an electron app. No spikes nor "extreme gpu usage" at all. Furthermore, I tried to open totally filled (almost 10k users) rooms, but CPU and GPU usage are still low, as expected. Maybe it is already solved by now?
Version von Element: 1.11.97 Krypto-Version: Rust SDK 0.10.0 (3cc301d), Vodozemac 0.9.0