logstash
 logstash copied to clipboard
PoC to add cgroup v2 support
Release notes
[rn:skip]
What does this PR do?
Very rudimentary implementation to parse cgroup v2 information. This PR code should just be a PoC. It shows, that - at least - the CPU information of a process running in cgroup v2 can be successfully retrieved and returned by logstash (and fix issue https://github.com/elastic/logstash/issues/14534)
Why is it important/What is the impact to the user?
When running logstash on a VM or container, that is already using the cgroup v2, no metrics will be exposed by logstash and are therefore missing within Stack Monitoring
Checklist
Nothing got checked on my side
- [ ] My code follows the style guidelines of this project
- [ ] I have commented my code, particularly in hard-to-understand areas
- [ ] I have made corresponding changes to the documentation
- [ ] I have made corresponding change to the default configuration files (and/or docker env variables)
- [ ] I have added tests that prove my fix is effective or that my feature works
Author's Checklist
How to test this PR locally
- create a VM that uses
cgroup2fs. You can verify this by runningstat -fc %T /sys/fs/cgroup. When runningcgroup v2, the result should becgroup2fs. See example
logstash@in-beats-1:/opt$ stat -fc %T /sys/fs/cgroup/
cgroup2fs
logstash@in-beats-1:/opt$
- run logstash and check the API via
curl localhost:9600/_node/stats?pretty. Results should contain anosobject looking somehow like this
{
  "host" : "in-beats-1",
  "version" : "8.5.0",
  "http_address" : "0.0.0.0:9600",
  "id" : "02e938c4-9a6a-4e38-8023-ca54b86d685c",
  "name" : "in-beats-1",
  "ephemeral_id" : "5343f7f9-093c-4031-aaa3-e24a6312588a",
  "status" : "green",
  "snapshot" : true,
  "pipeline" : {
    "workers" : 4,
    "batch_size" : 125,
    "batch_delay" : 50
  },
  "monitoring" : {
    "cluster_uuid" : "some_cluster_id"
  },
  "jvm" : {
    "threads" : {
      "count" : 206,
      "peak_count" : 208
    },
...
...
  "os" : {
    "cgroup" : {
      "cpuacct" : {
        "control_group" : "/",
        "usage_nanos" : 895076842
      },
      "cpu" : {
        "control_group" : "/",
        "cfs_period_micros" : 100000,
        "cfs_quota_micros" : 400000,
        "stat" : {
          "number_of_times_throttled" : 142,
          "number_of_elapsed_periods" : 58122,
          "time_throttled_nanos" : 65119181
        }
      }
    }
  },
  "queue" : {
    "events_count" : 0
  }
}
Related issues
- Relates #14534
Use cases
Screenshots

And here from the running pod
"os" : {
    "cgroup" : {
      "cpu" : {
        "stat" : {
          "time_throttled_nanos" : 70506861,
          "number_of_elapsed_periods" : 63733,
          "number_of_times_throttled" : 145
        },
        "cfs_quota_micros" : 400000,
        "control_group" : "/",
        "cfs_period_micros" : 100000
      },
      "cpuacct" : {
        "control_group" : "/",
        "usage_nanos" : 908588206
      }
    }
  }
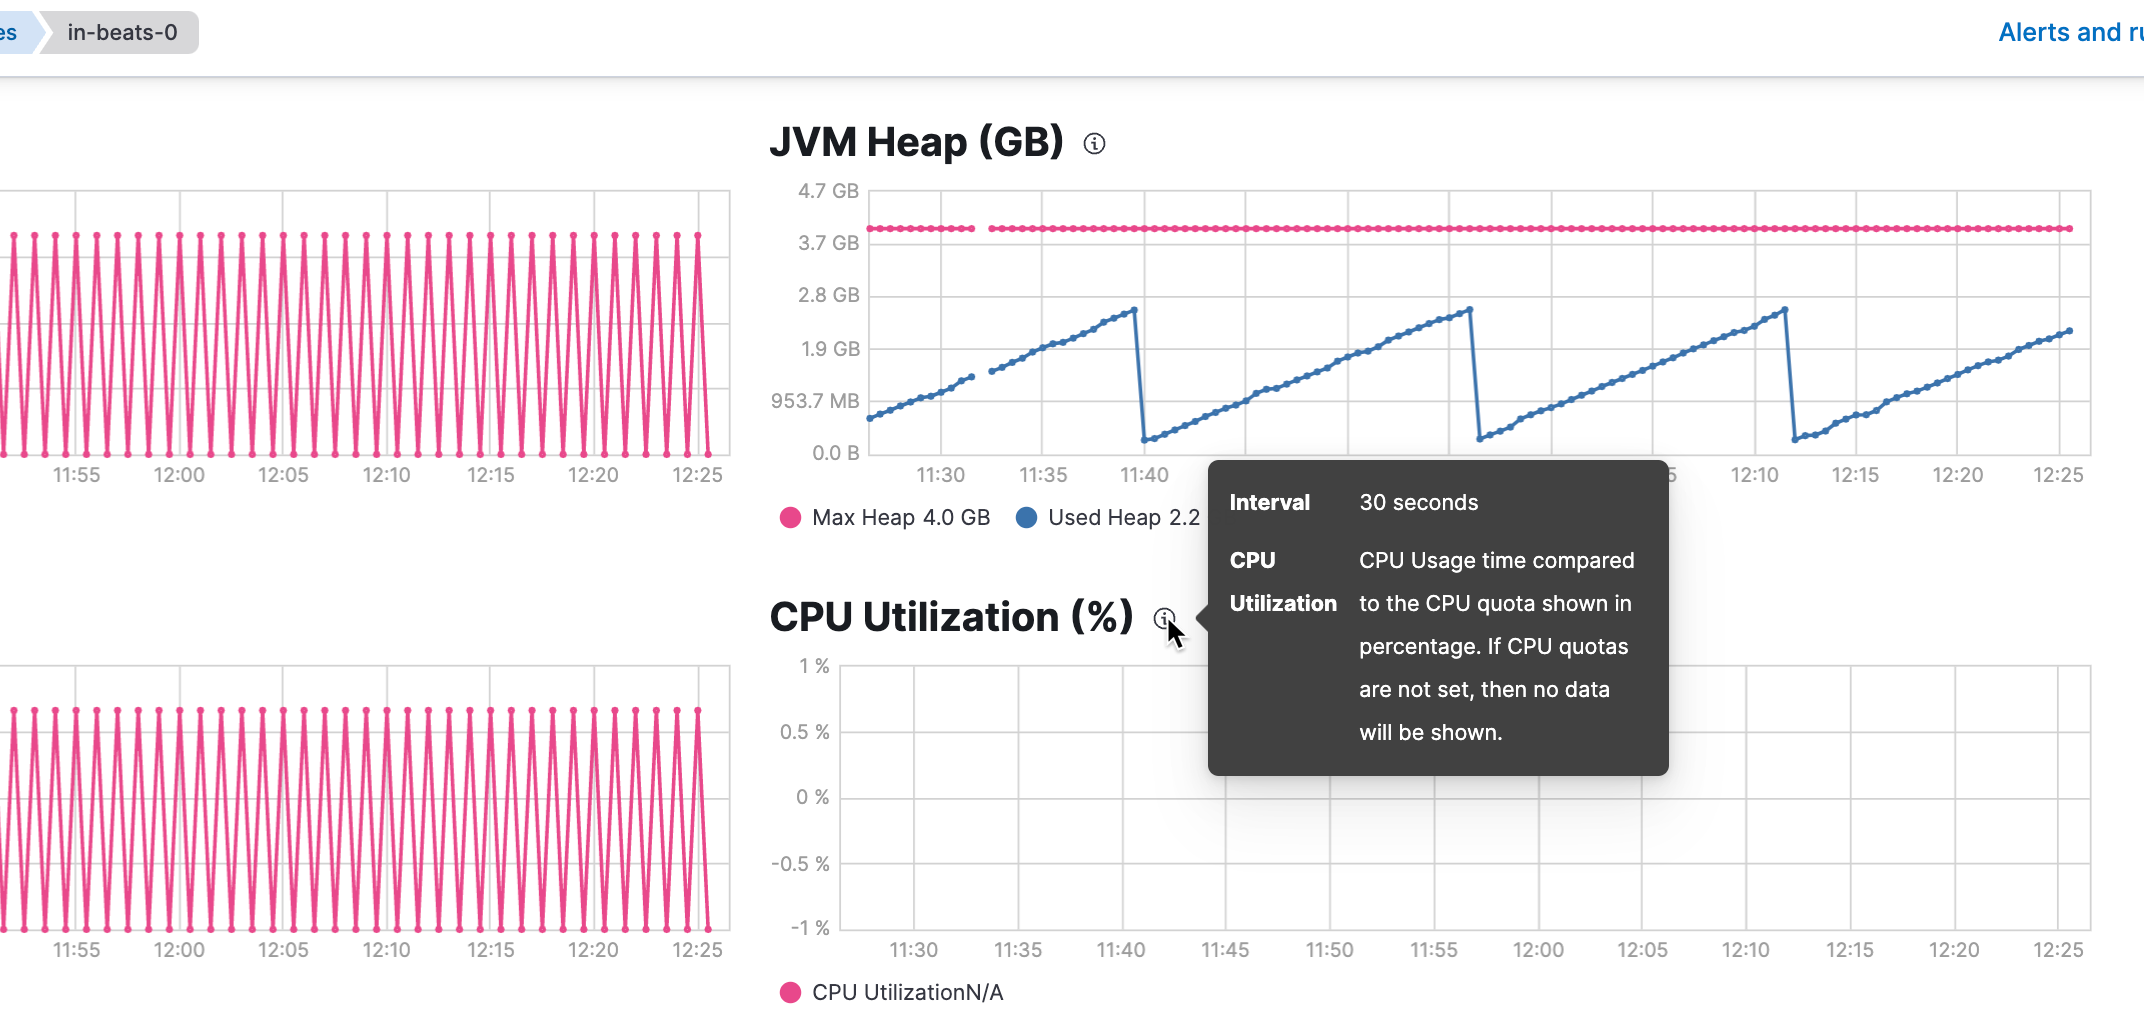
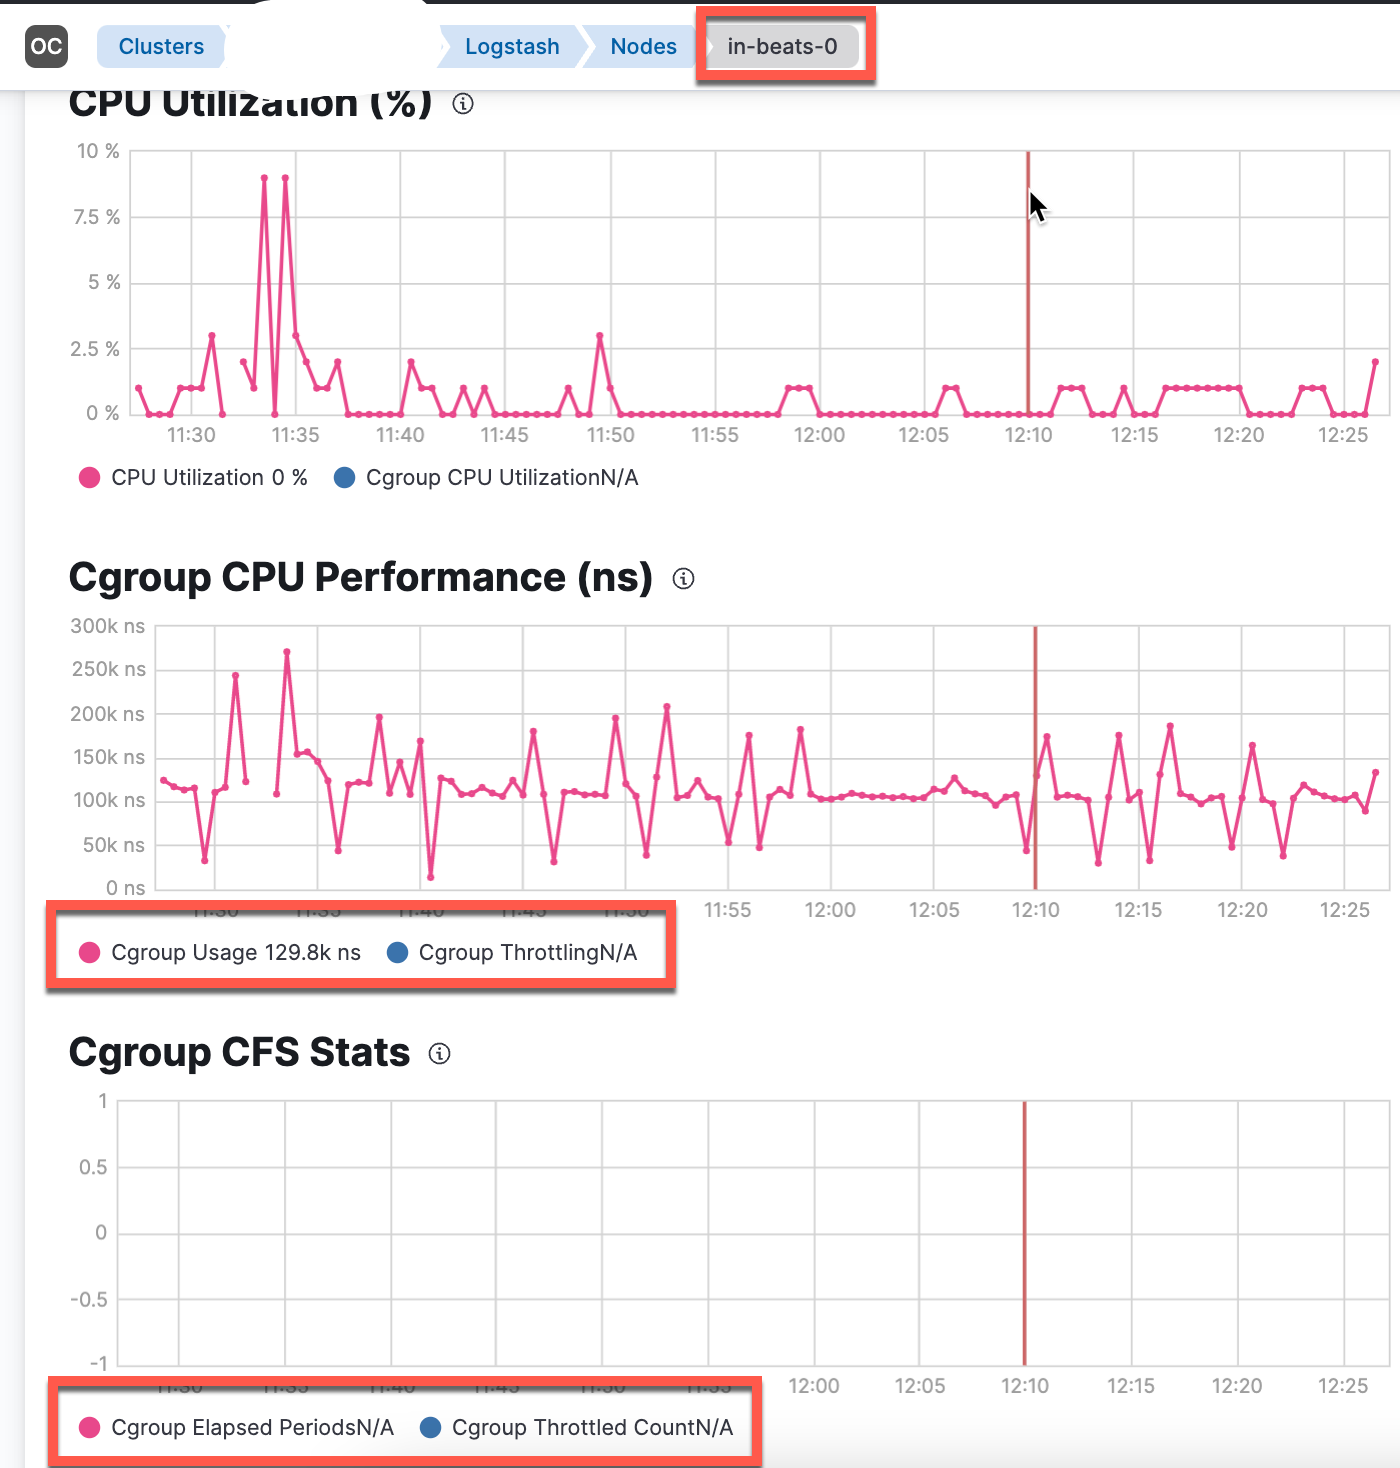
Note: Still something is missing
Still, the Stack Monitoring does not fully work. It looks like the cfs values are exported by logstash, but they are not picked up by metricbeat (the node and node_stats code of logstash module do not contain a JSON structure to use - at least - the cfs_quota_micros values returned (see also https://github.com/elastic/beats/blob/main/metricbeat/module/logstash/node_stats/data.go#L79)
Logs
Since this is a community submitted pull request, a Jenkins build has not been kicked off automatically. Can an Elastic organization member please verify the contents of this patch and then kick off a build manually?
Sorry....some missing infos:
- Stack Monitoring (elasticsearch, kibana, metricbeat):
8.4.1version - logstash: latest code of
mainbranch + PoC code
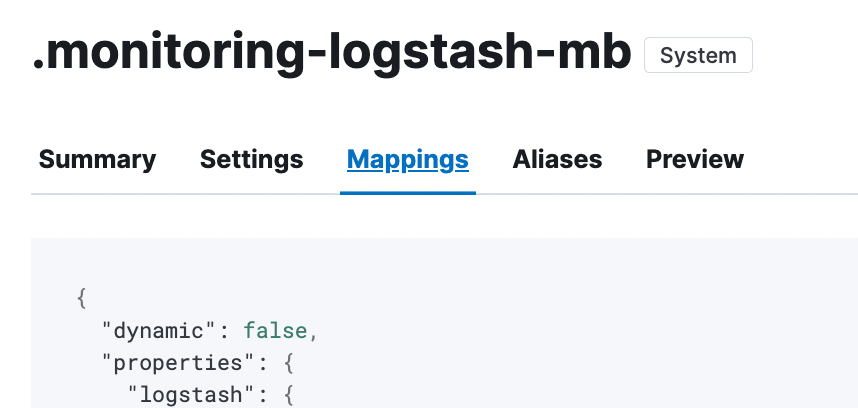
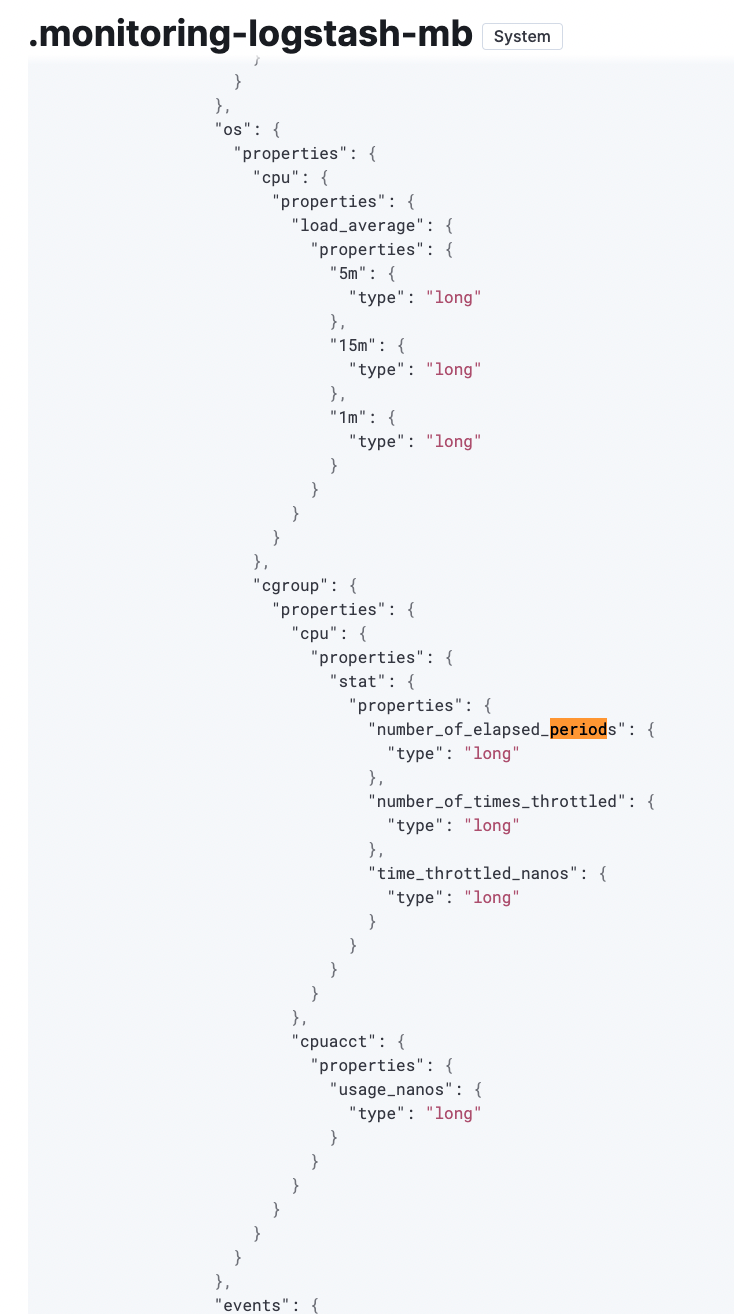
This screenshot was taken from the .monitoring-logstash-8-mb data-stream
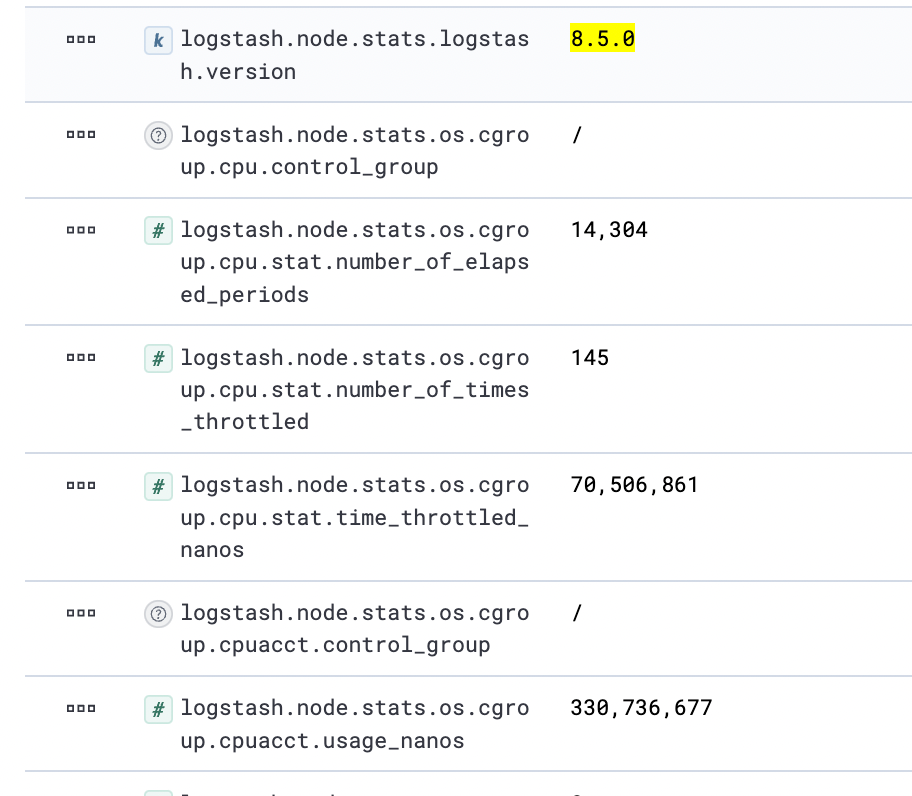
which has dynmatic set to false and no mapping for cfs fields exist