Determine best G1GC flags to avoid too much compromise on performance and memory consumption
Summary
Switching from CMS to G1 with default settings show a lower evt/sec throughput at same CPU consumption and major Java heap occupancy. While the heap consumption is something that is ruled by GC policy and don't becomes critical until it trigger too much stop the world GCs. G1 has the MaxGCPauseMillis is a soft goal for maximum GC pause time and to match it the GC sacrifice throughput. So raising it up provides better throughput at the expense of ~14% more CPU usage, however this is a limit in time pause that CMS can't grant us, when CMS stops it can't be managed how log it stops and this increase the latency in uncontrolled way.
Another setting available to configure the G1 is InitiatingHeapOccupancyPercent which control when a concurrent GC has to be started. Too low values make kicks in too frequently, too much high means that it has to do more work, so a good balance of this make to queeze the performances without sacrifyng the CPU occupancy.
From the experiments conducted the G1 with -XX:MaxGCPauseMillis=500 and -XX:InitiatingHeapOccupancyPercent=30 provide an increment of ~14% in throughtput at the cost of ~14% increase in CPU usage.
Investigation
G1 has the statement to minimize GC pauses at the expense of throughput. This issue is a notebook used to track discoveries.
First basic experiment Pipeline used:
input {
  generator {
    message => '{"some": "value"}'
  }
}

output {
  sink {
    enable_metric => "true"
}
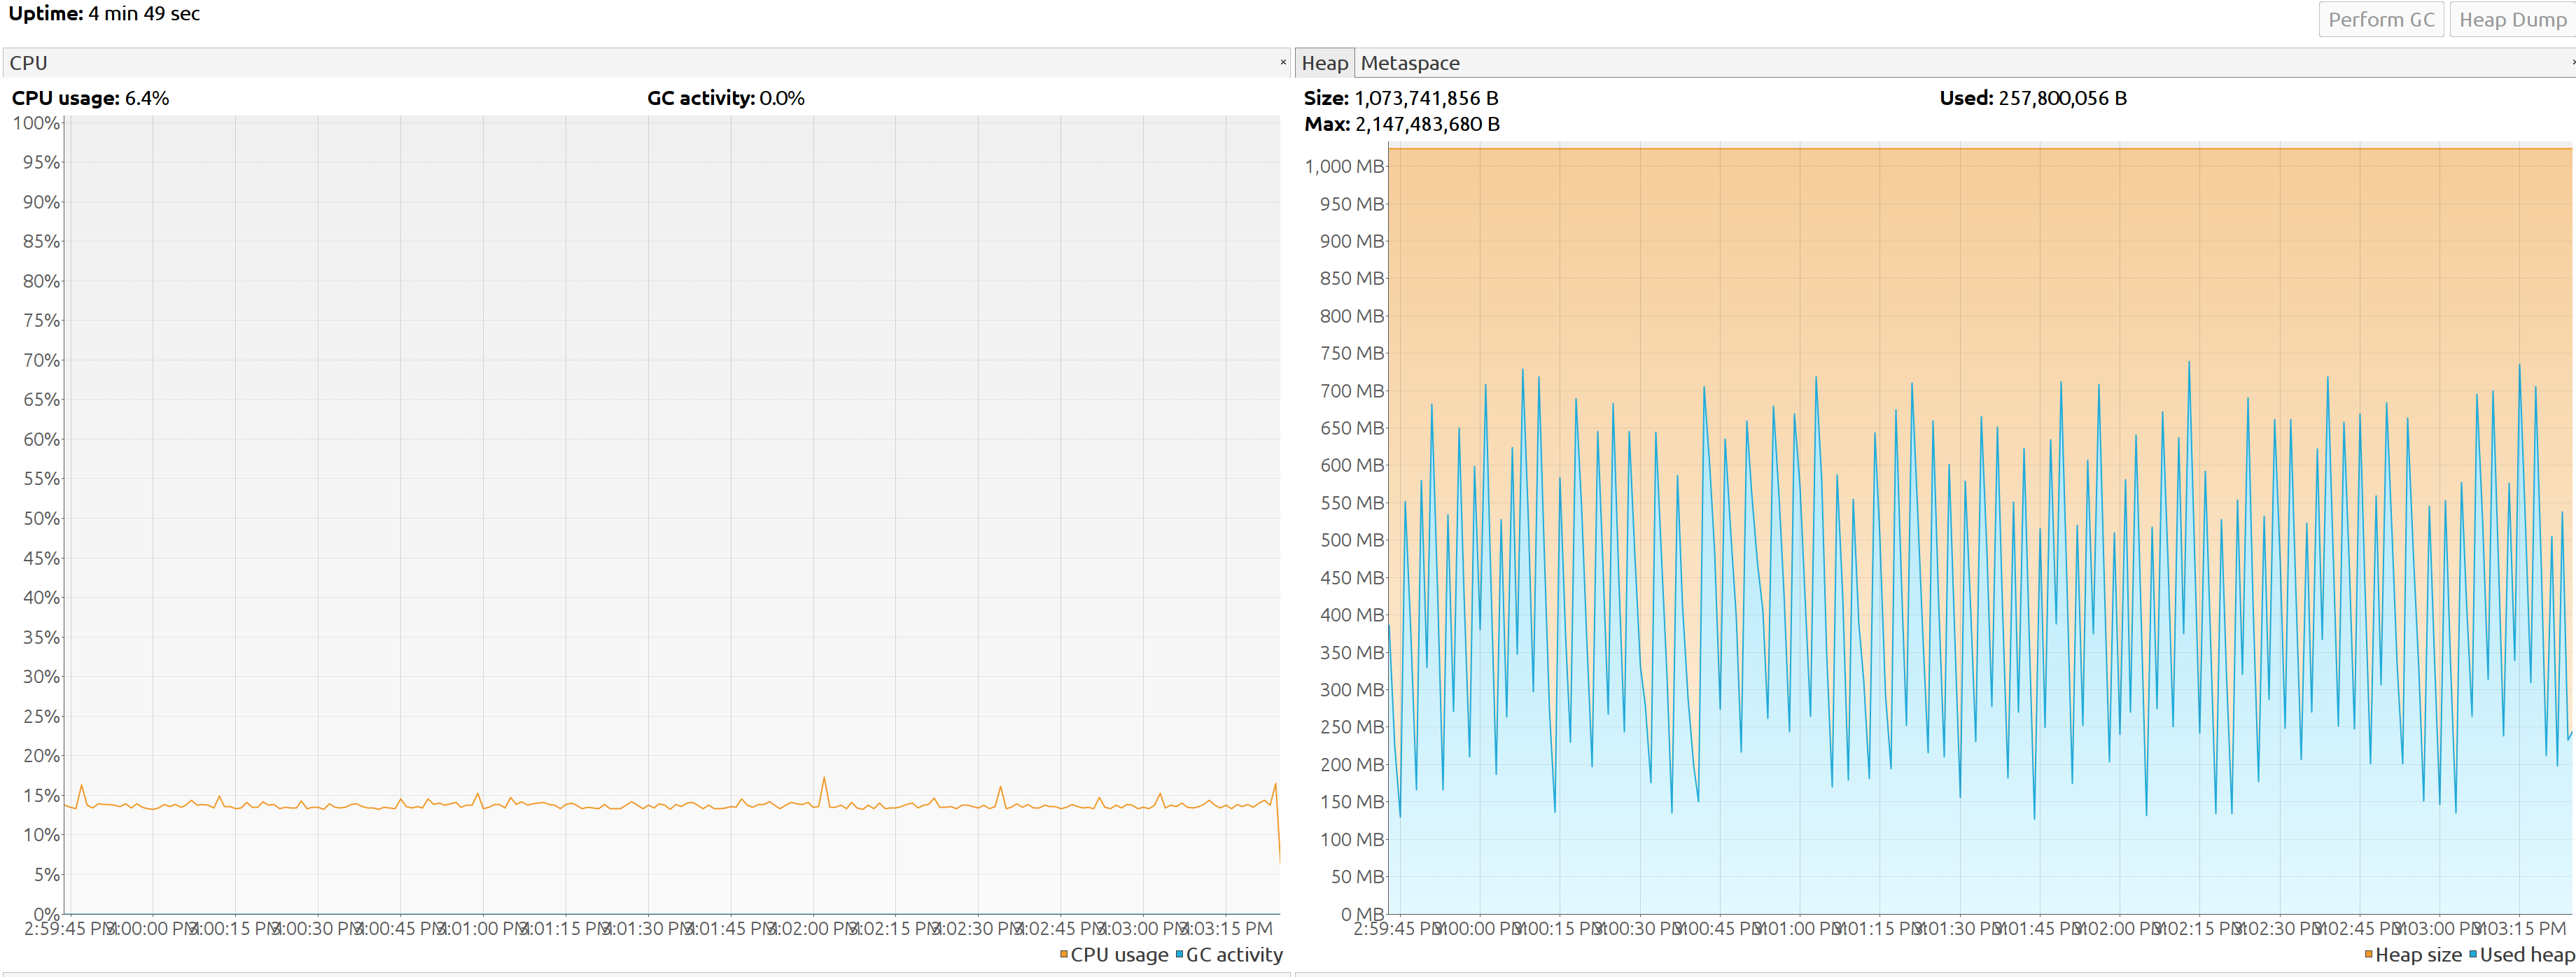
Tracking GC cpu time and consumed memory between CMS (JDK 11) and G1(JDK 11) becomes evident that while the CPU % remain the same the Java heap fluctuate more on G1.(screenshot from JVisualVM)
CMS JDK 11
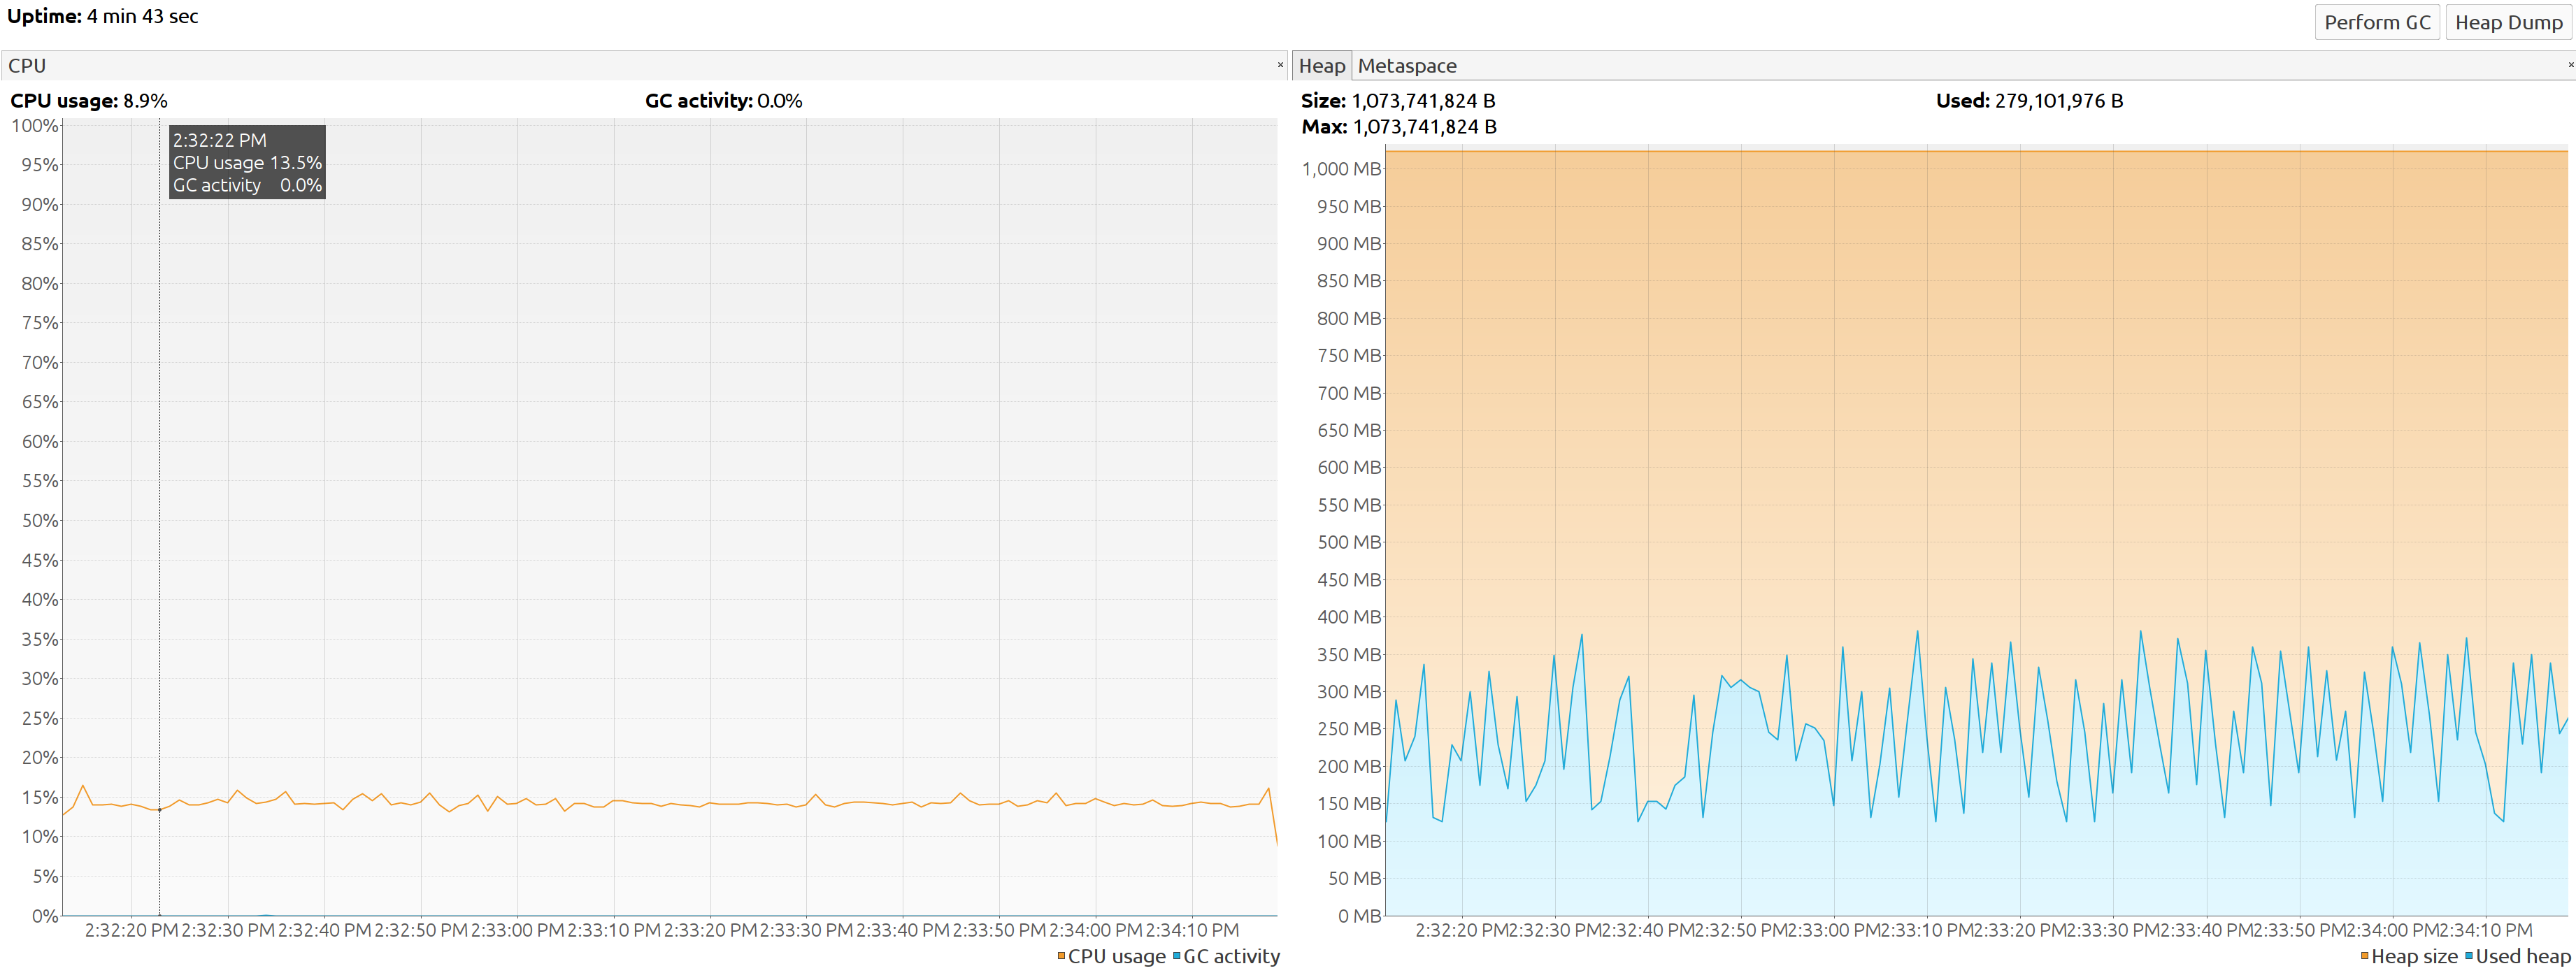G1 JDK 17
Incrementing the load Previous experiment simply demonstrated that G1 use more space on the Java heap then CMS, but how goes with throughput? To verify it use the following pipeline input:
input {
  generator {
    message => '{"some": "value"}'
    count => 30000000 #30M events ~10 minutes on my machine
  }
}
and spawn 1/3 of the CPU cores pipelines in config/pipelines.yml:
- pipeline.id: perf1
  path.config: "/tmp/performance_pipelines/simple_gen_sink.conf"

- pipeline.id: perf2
  path.config: "/tmp/performance_pipelines/simple_gen_sink.conf"

- pipeline.id: perf3
  path.config: "/tmp/performance_pipelines/simple_gen_sink.conf"

- pipeline.id: perf4
  path.config: "/tmp/performance_pipelines/simple_gen_sink.conf"
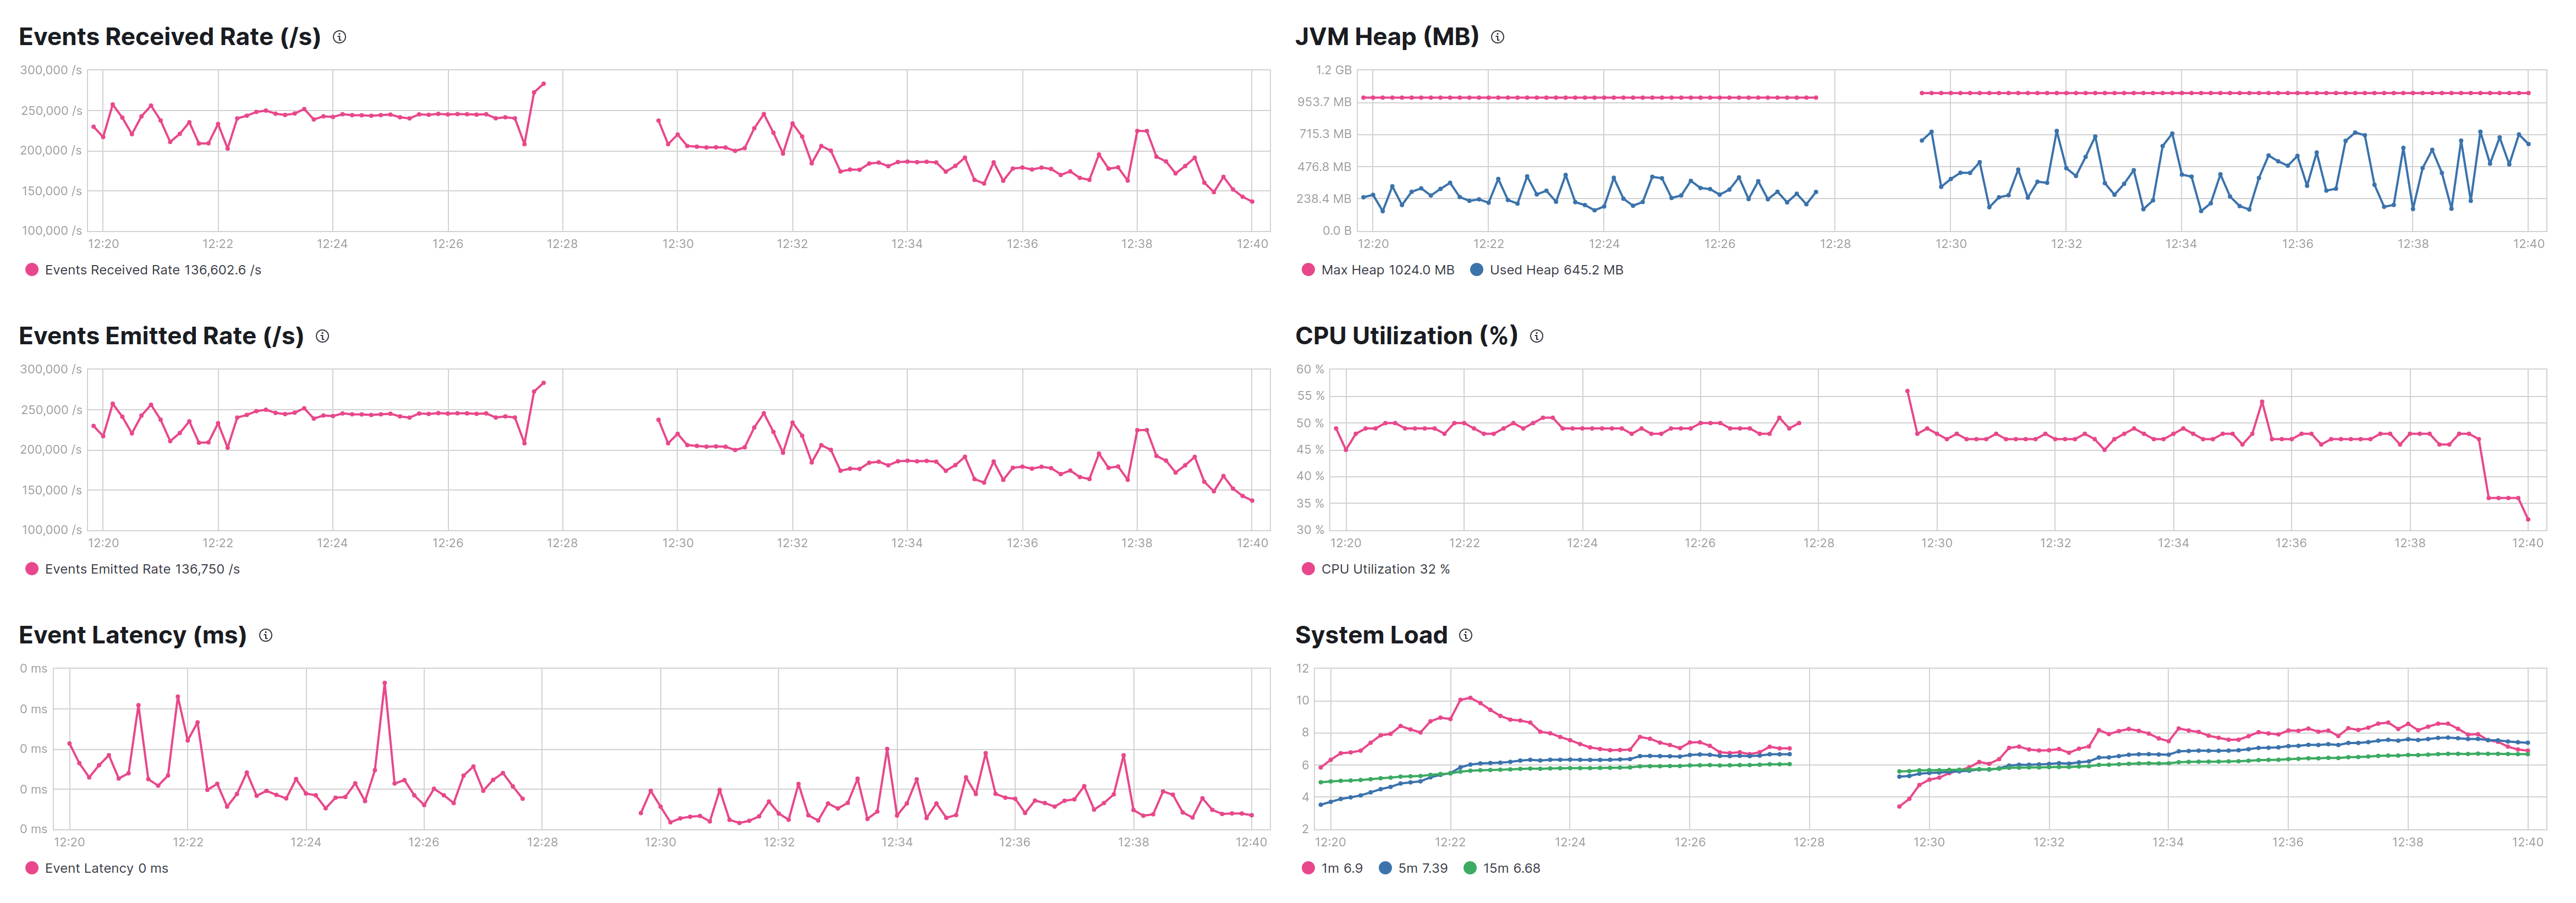
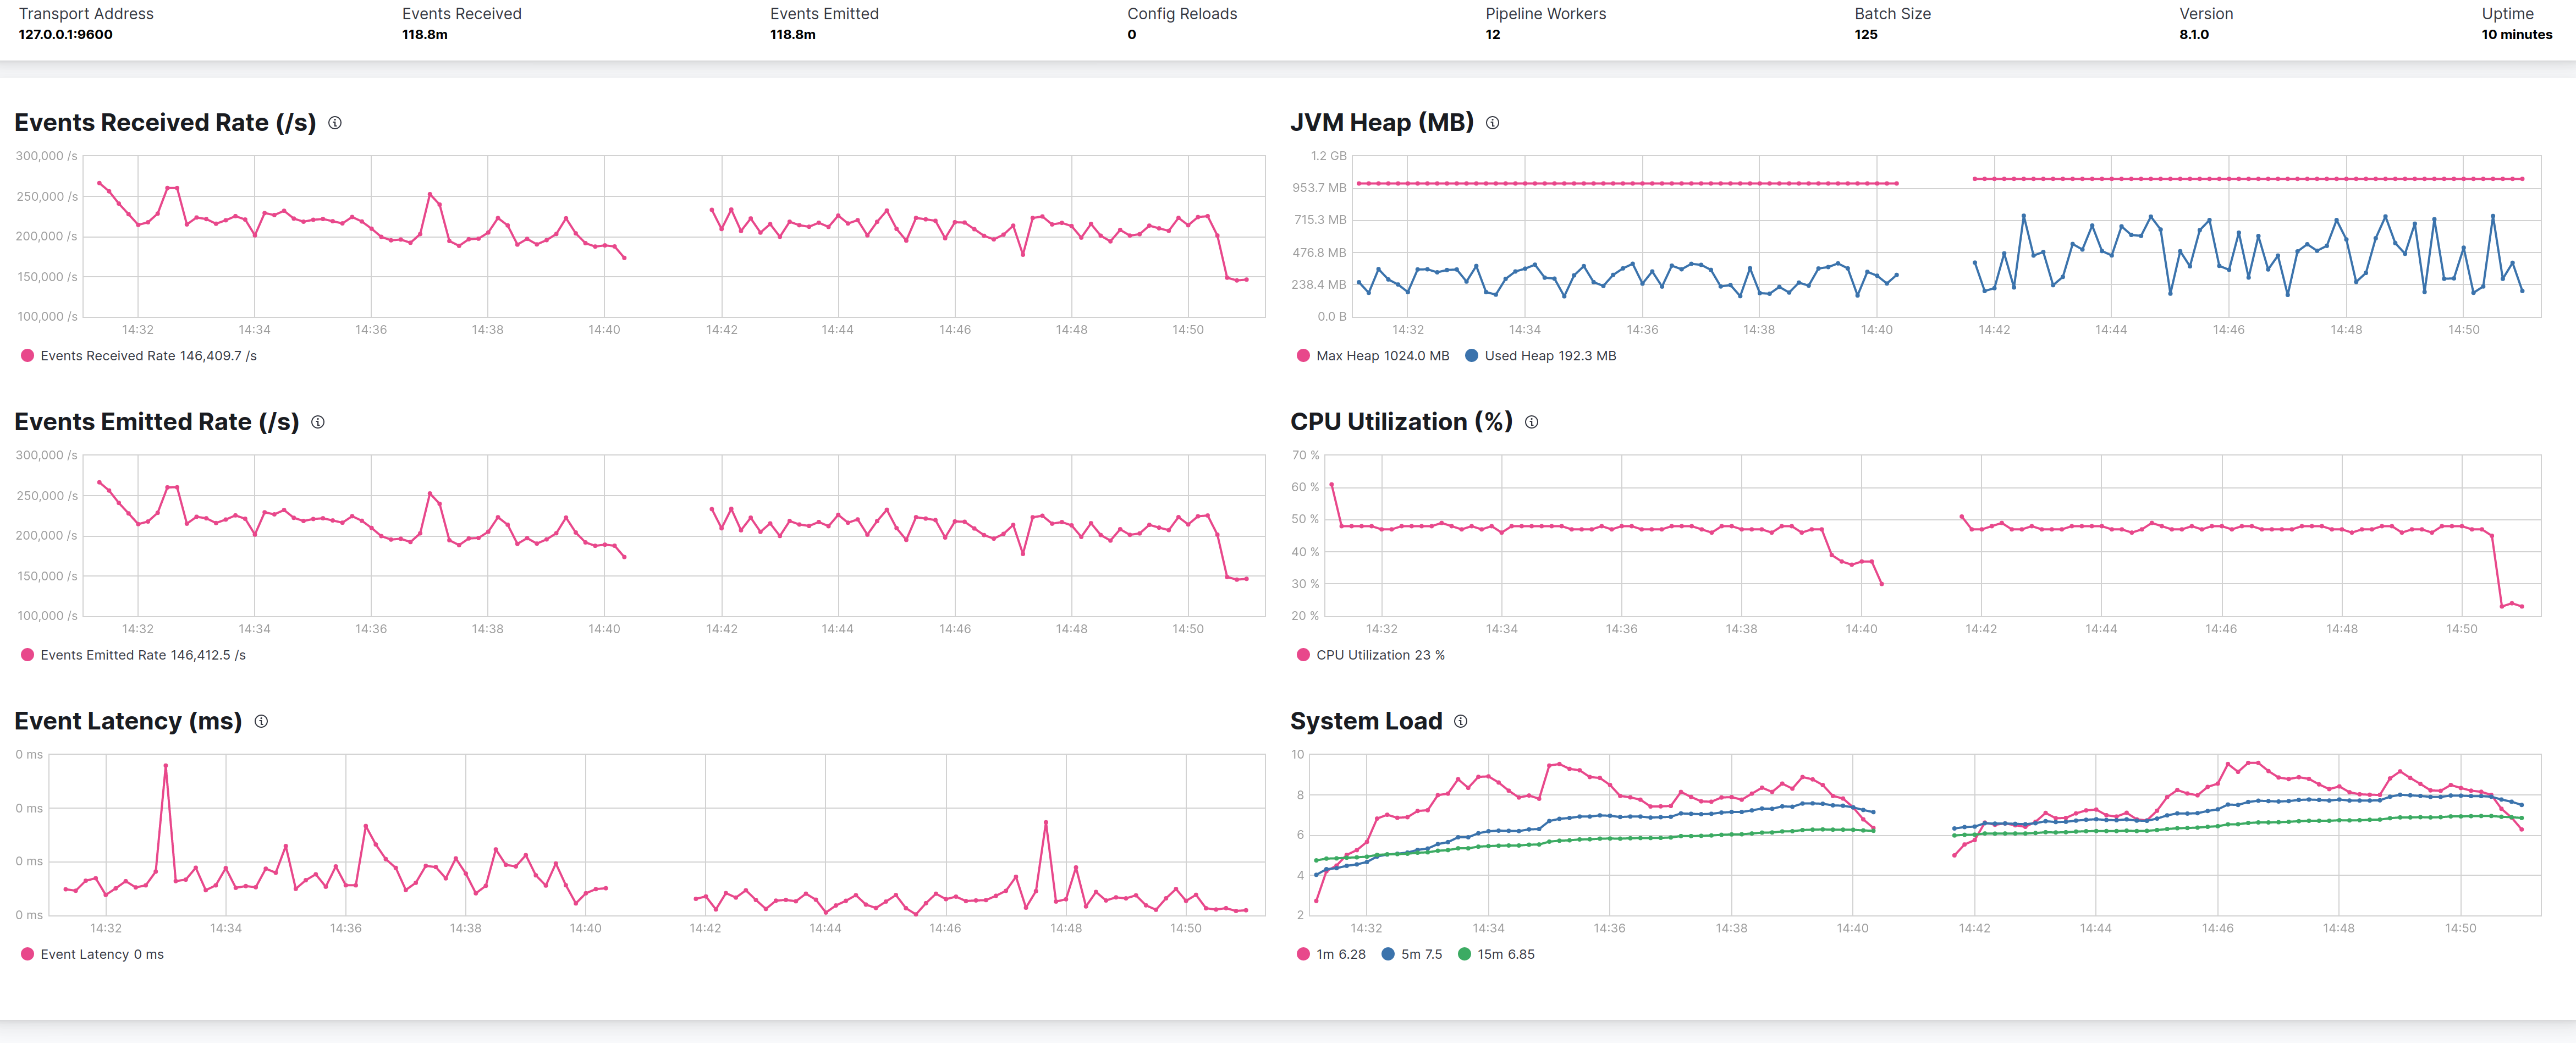
This is needed to load Logstash but don't saturate the host, and seems that under CMS Logstash process ~230K evt/sec against ~180K evt/sec under G1.
The left part of the graphs is CMS, the right G1
MaxGCPauseMillis
Logging the GC activity to check that no FullGCs creates interference doesn't expose anything meaningful. Both CMS and G1 executes 9 fullGCs during the first seconds of run due to some code path that explicitly invokes System.gc().
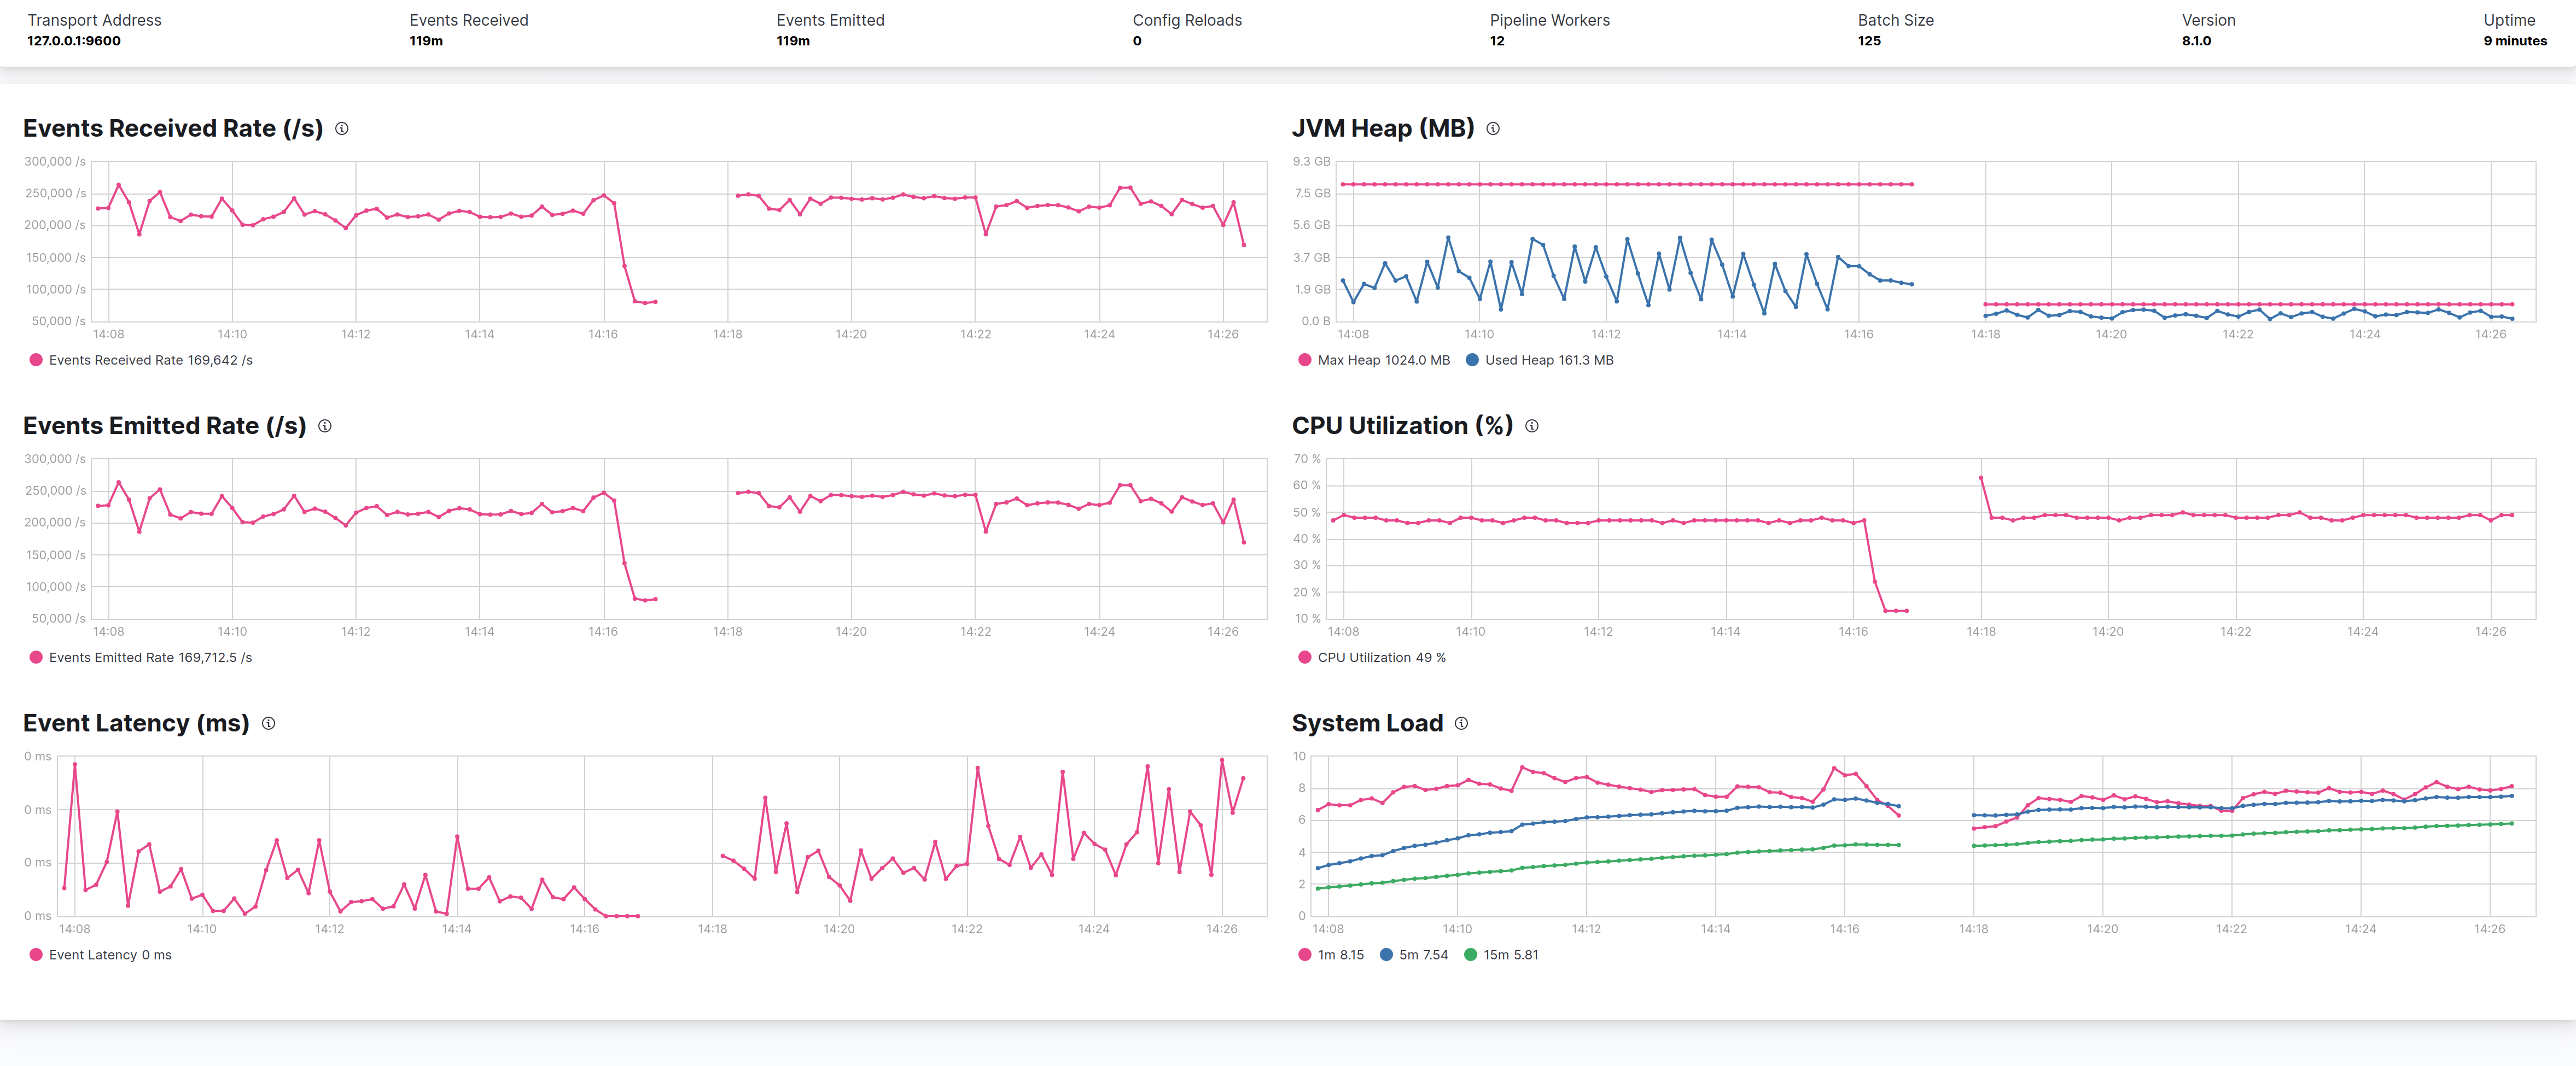
G1 has a lot autotuning capabilities but is centered on max pause, by default it's 200ms, raising to 500ms, CMS and G1 shows same throghtput at expense of more heap usage in G1, but this is a characteristic of this GC.
The latency of events seems to be little bit lower in G1 case.
Giving G1 more memory
In this test I used an heap of 8GB instead of 1GB with G1 and -XX:MaxGCPauseMillis set at 500ms.
But the only small improvement seems to be a lower latency in messages.
Left of the graphs is G1 with 8GB heap, right is with 1GB
Use of more real life pipeline
MaxGCPauseMillis
The above test put evidence on the fact that G1 with -XX:MaxGCPauseMillis=500 could perform little bit better of CMS, the following test leverages always the same pipeline definition used by 4 pipelines, but with a pipeline more close to a real live pipeline, with grok and mutate filters and if statements.
Pipeline definition
input {
  generator {
    lines => [
      '2.44.106.240 john s3cret [4/Nov/2021:13:55:36 -0700] "GET /apache_pb.gif HTTP/1.0" 200 2326 "http://www.example.com/start.html" "Mozilla/4.08 [en] (Win98; I ;Nav)"',
      '2.44.106.240 john s3cret [4/Nov/2021:13:55:36 -0700] "File does not exist: /var/www/favicon.ico"',
      '6.6.106.240 john s3cret [4/Nov/2021:13:55:36 -0700] "GET /apache_pb.gif HTTP/1.0" 200 2326 "{"name": "Jack the hacker"}" "Mozilla/4.08 [en] (Win98; I ;Nav)"'
    ]
    count => 5000000 # ~8mins
  }
}

filter {
  grok {
    match => {
      "message" => "^%{IPORHOST:clientip} %{USER:ident} %{USER:auth} \[%{HTTPDATE:timestamp}\] \"%{WORD:verb} %{DATA:remaining}$"
    }
  }

  date {
    match => [ "timestamp", "dd/MMM/YYYY:HH:mm:ss Z" ]
    locale => en
  }

  mutate { remove_field => ["timestamp"] }

  geoip {
    source => "clientip"
  }

  if [verb] == "File" {
    mutate {
      copy => { "remaining" => "missed_file" }
    }

    # keep only the filename
    mutate {
      gsub => [
        "missed_file", "does not exist: ", ""
      ]
    }
  } else {
    if [clientip] =~ /6\.6\..*/ {
      mutate { add_tag => "_blacklisted" }

      grok {
        match => {
          "remaining" => "^%{DATA:request} HTTP/%{NUMBER:httpversion}\" %{NUMBER:response:int} (?:-|%{NUMBER:bytes:int}) %{DATA:content} %{QS:agent}$"
        }
      }

      mutate {
        gsub => ["content", "\"{", "{"]
        gsub => ["content", "}\"", "}"]
      }

      json { source => "content" }

      clone { clones => ["twin"]}

    } else {
      grok {
        match => {
          "remaining" => "^%{DATA:request} HTTP/%{NUMBER:httpversion}\" %{NUMBER:response:int} (?:-|%{NUMBER:bytes:int}) %{QS:referrer} %{QS:agent}$"
        }
      }
    }

    useragent {
      source => "agent"
      target => "useragent"
    }
  }
}


output {
  sink {
    enable_metric => "true"
  }
}
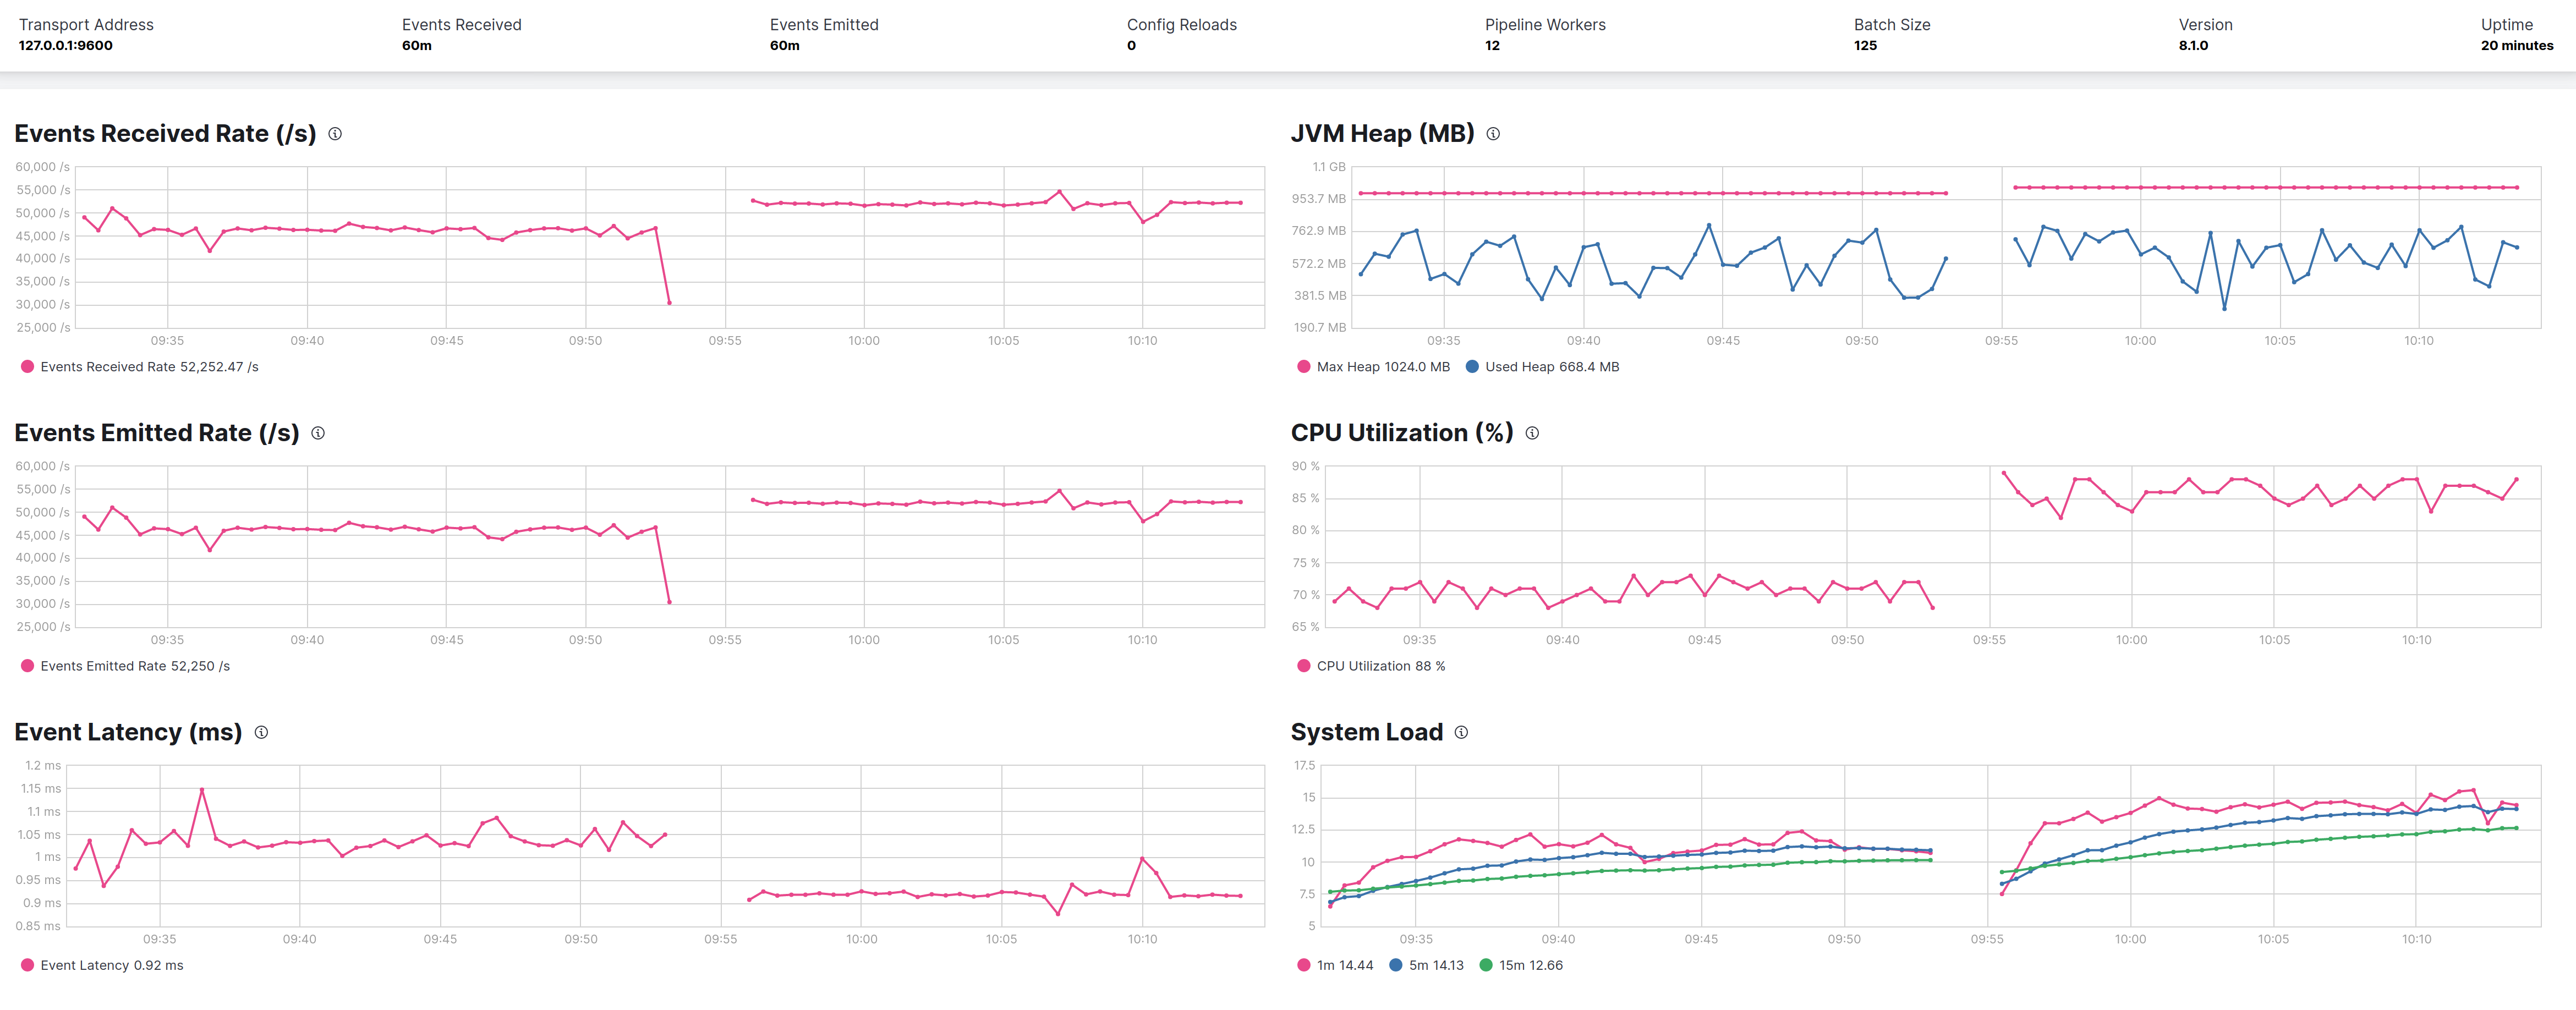
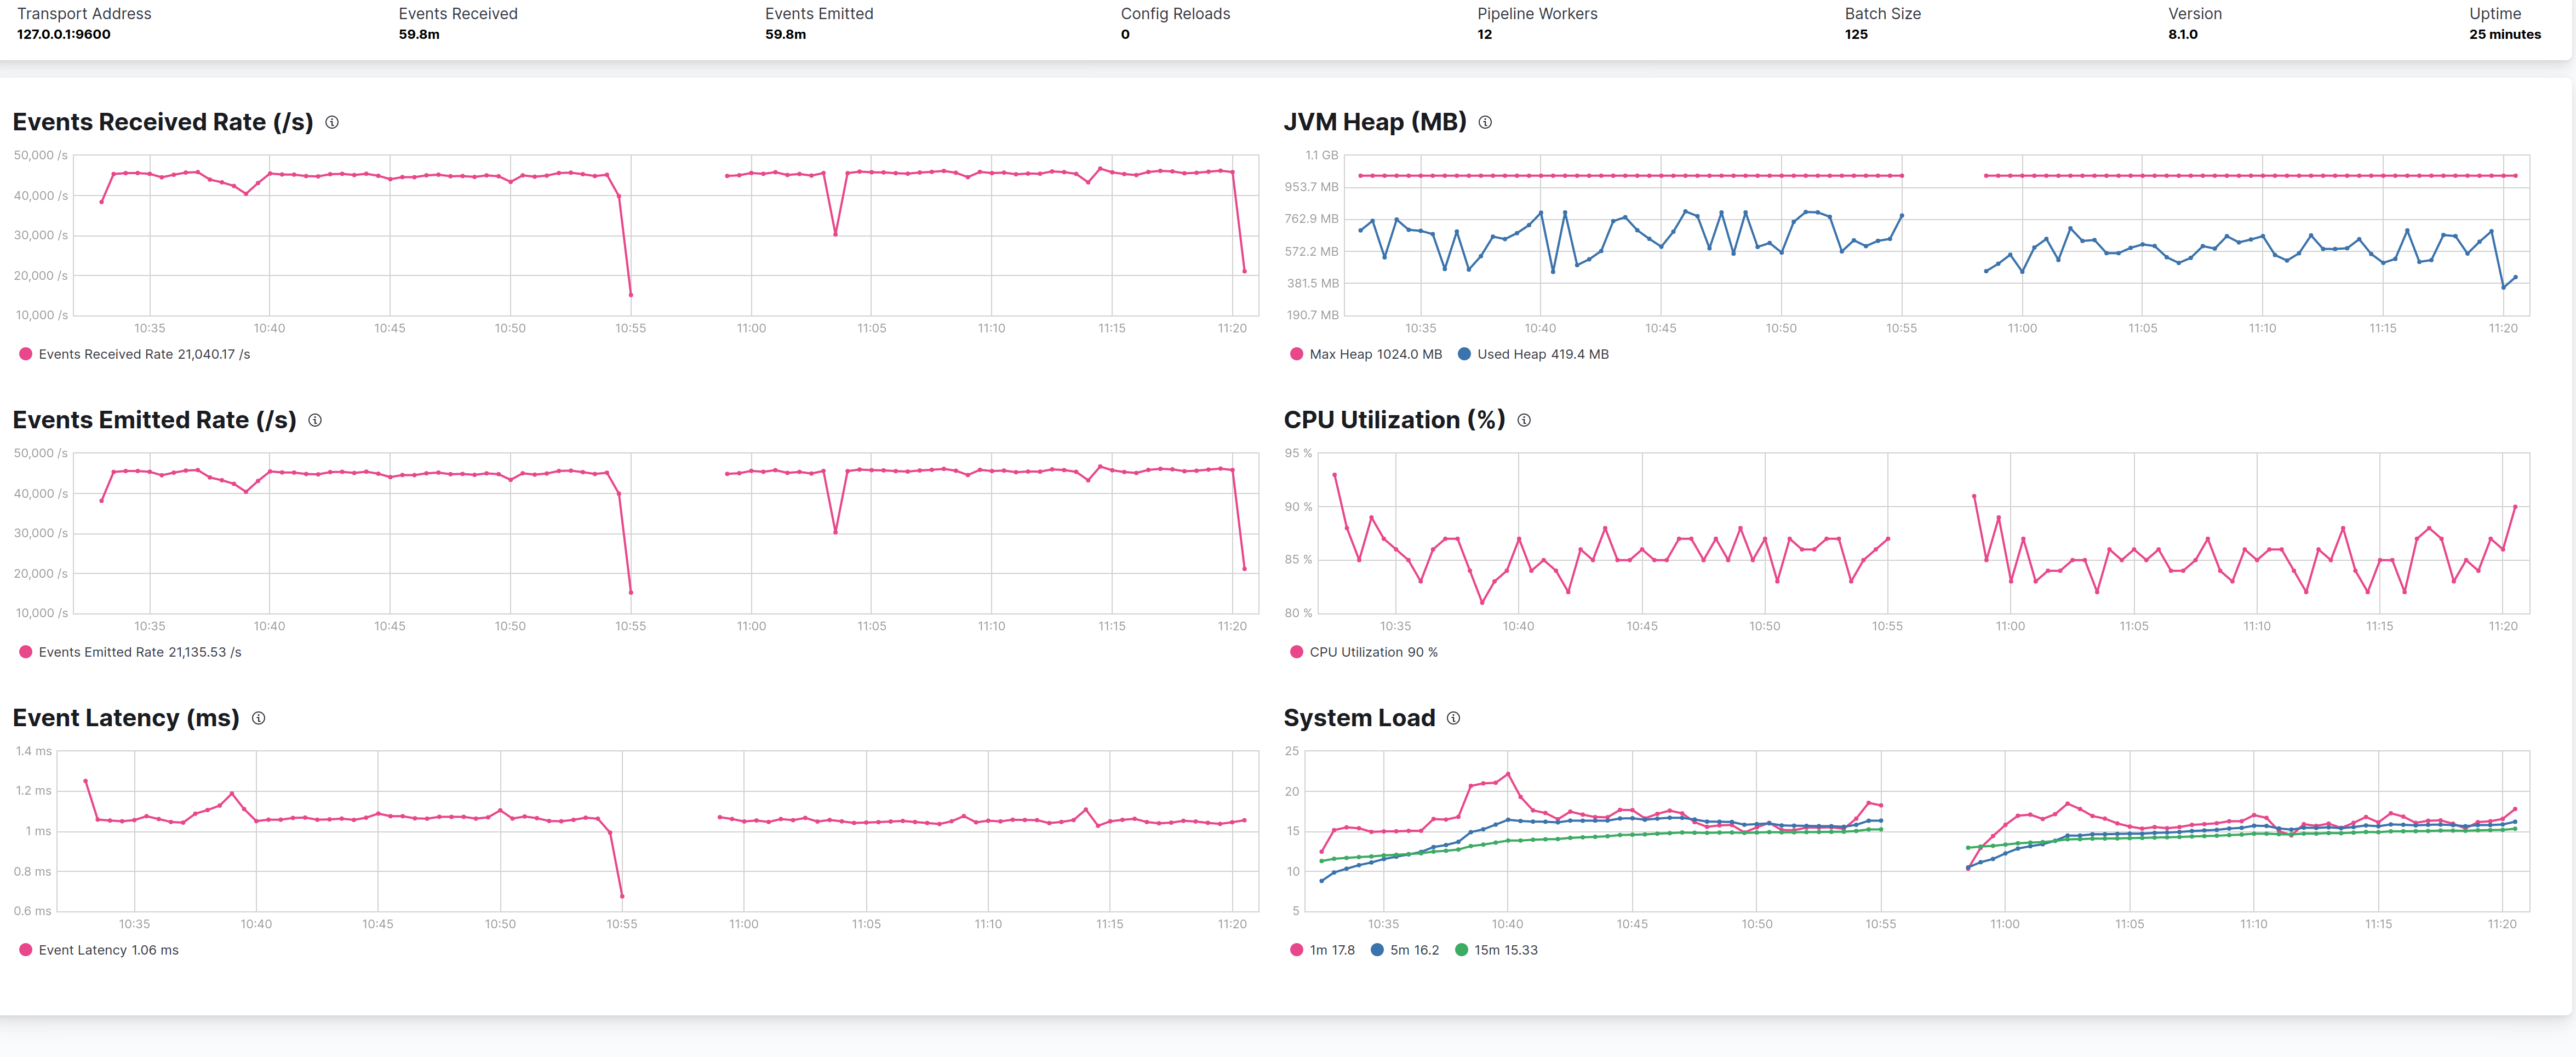
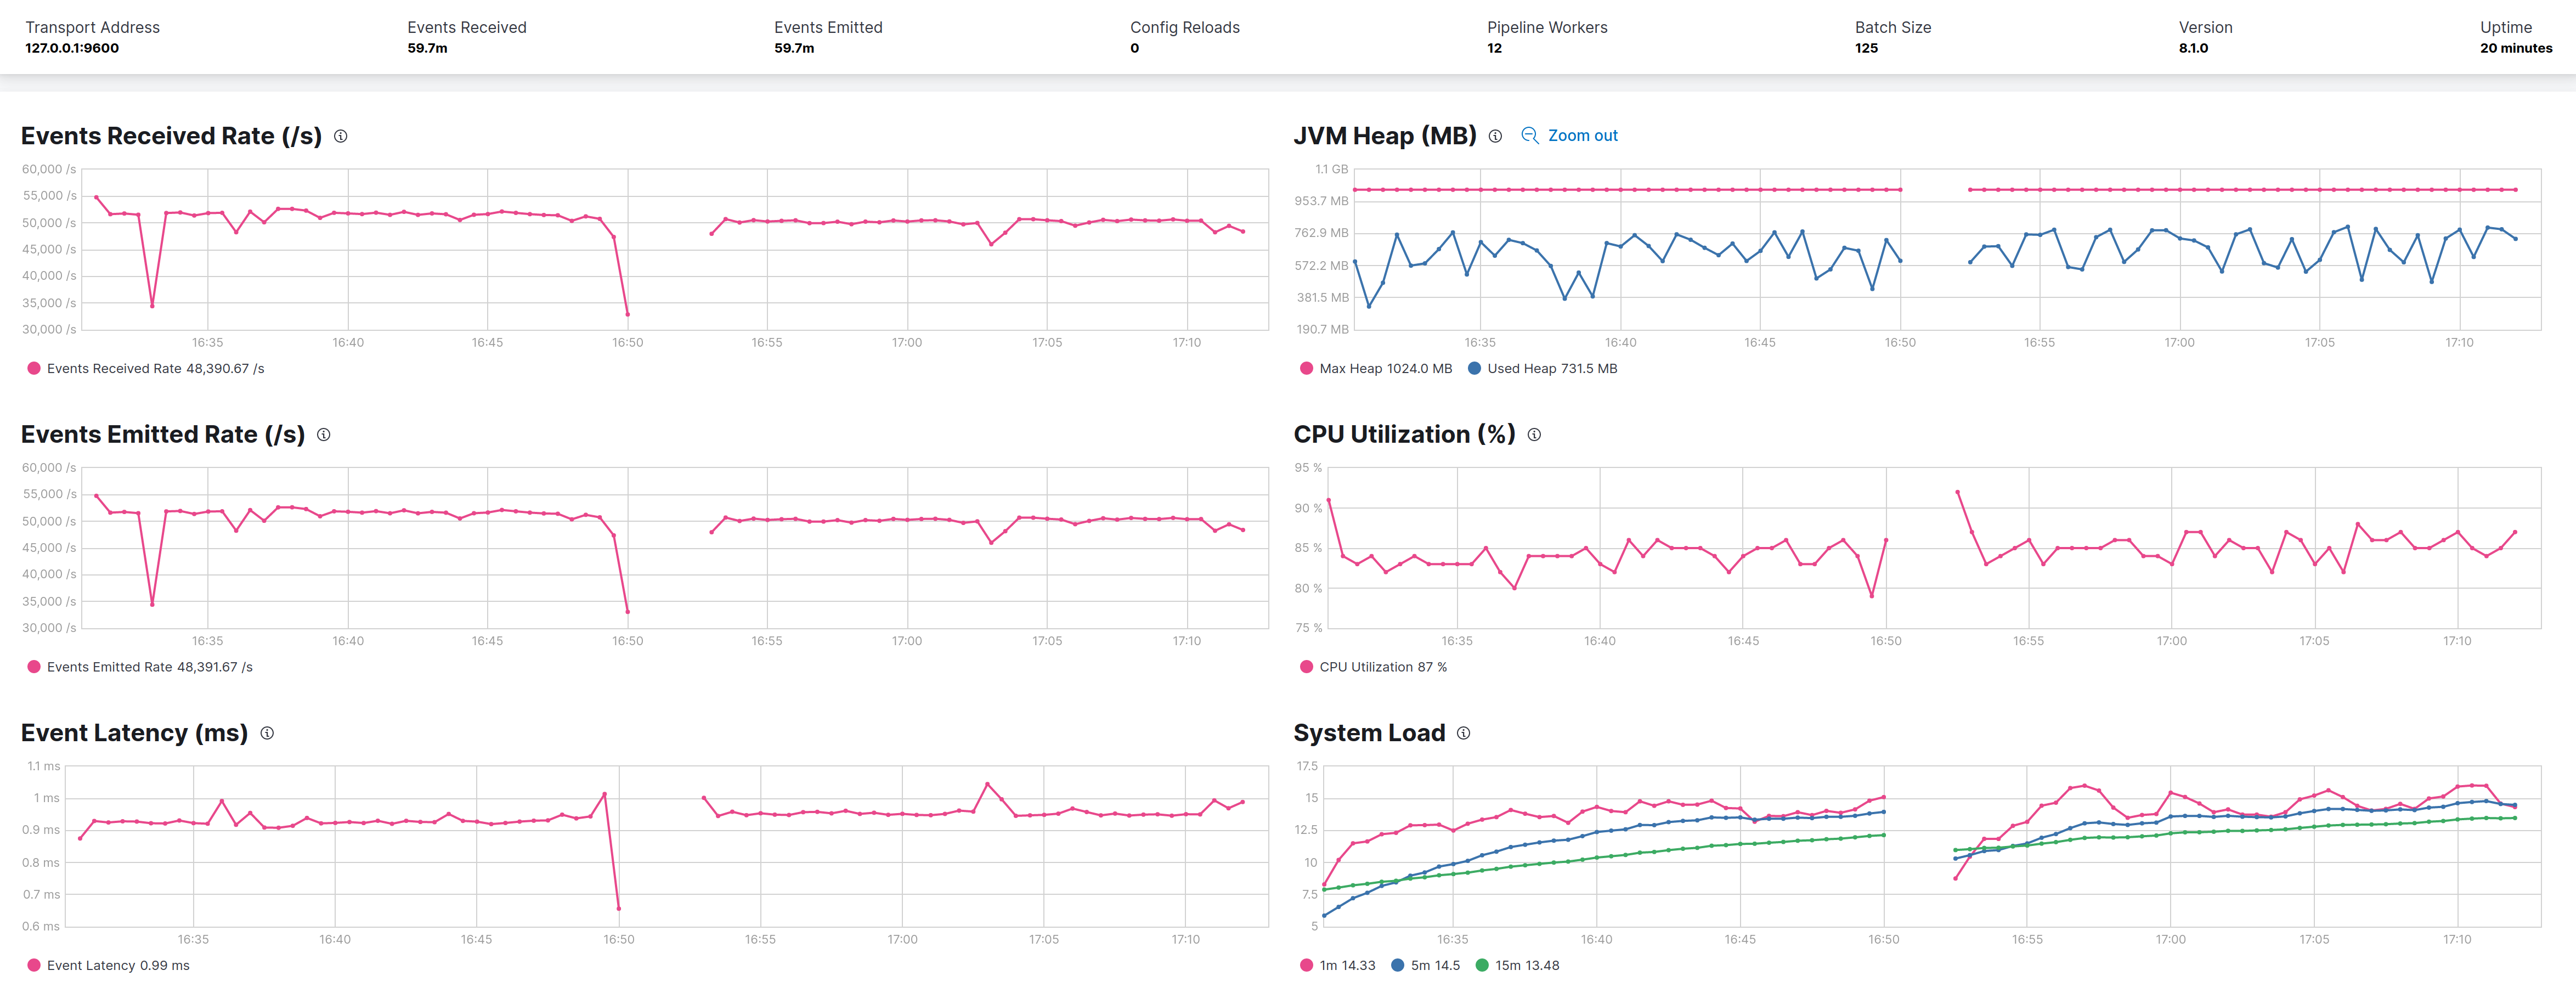
The results (as before left CMS right G1) follows:
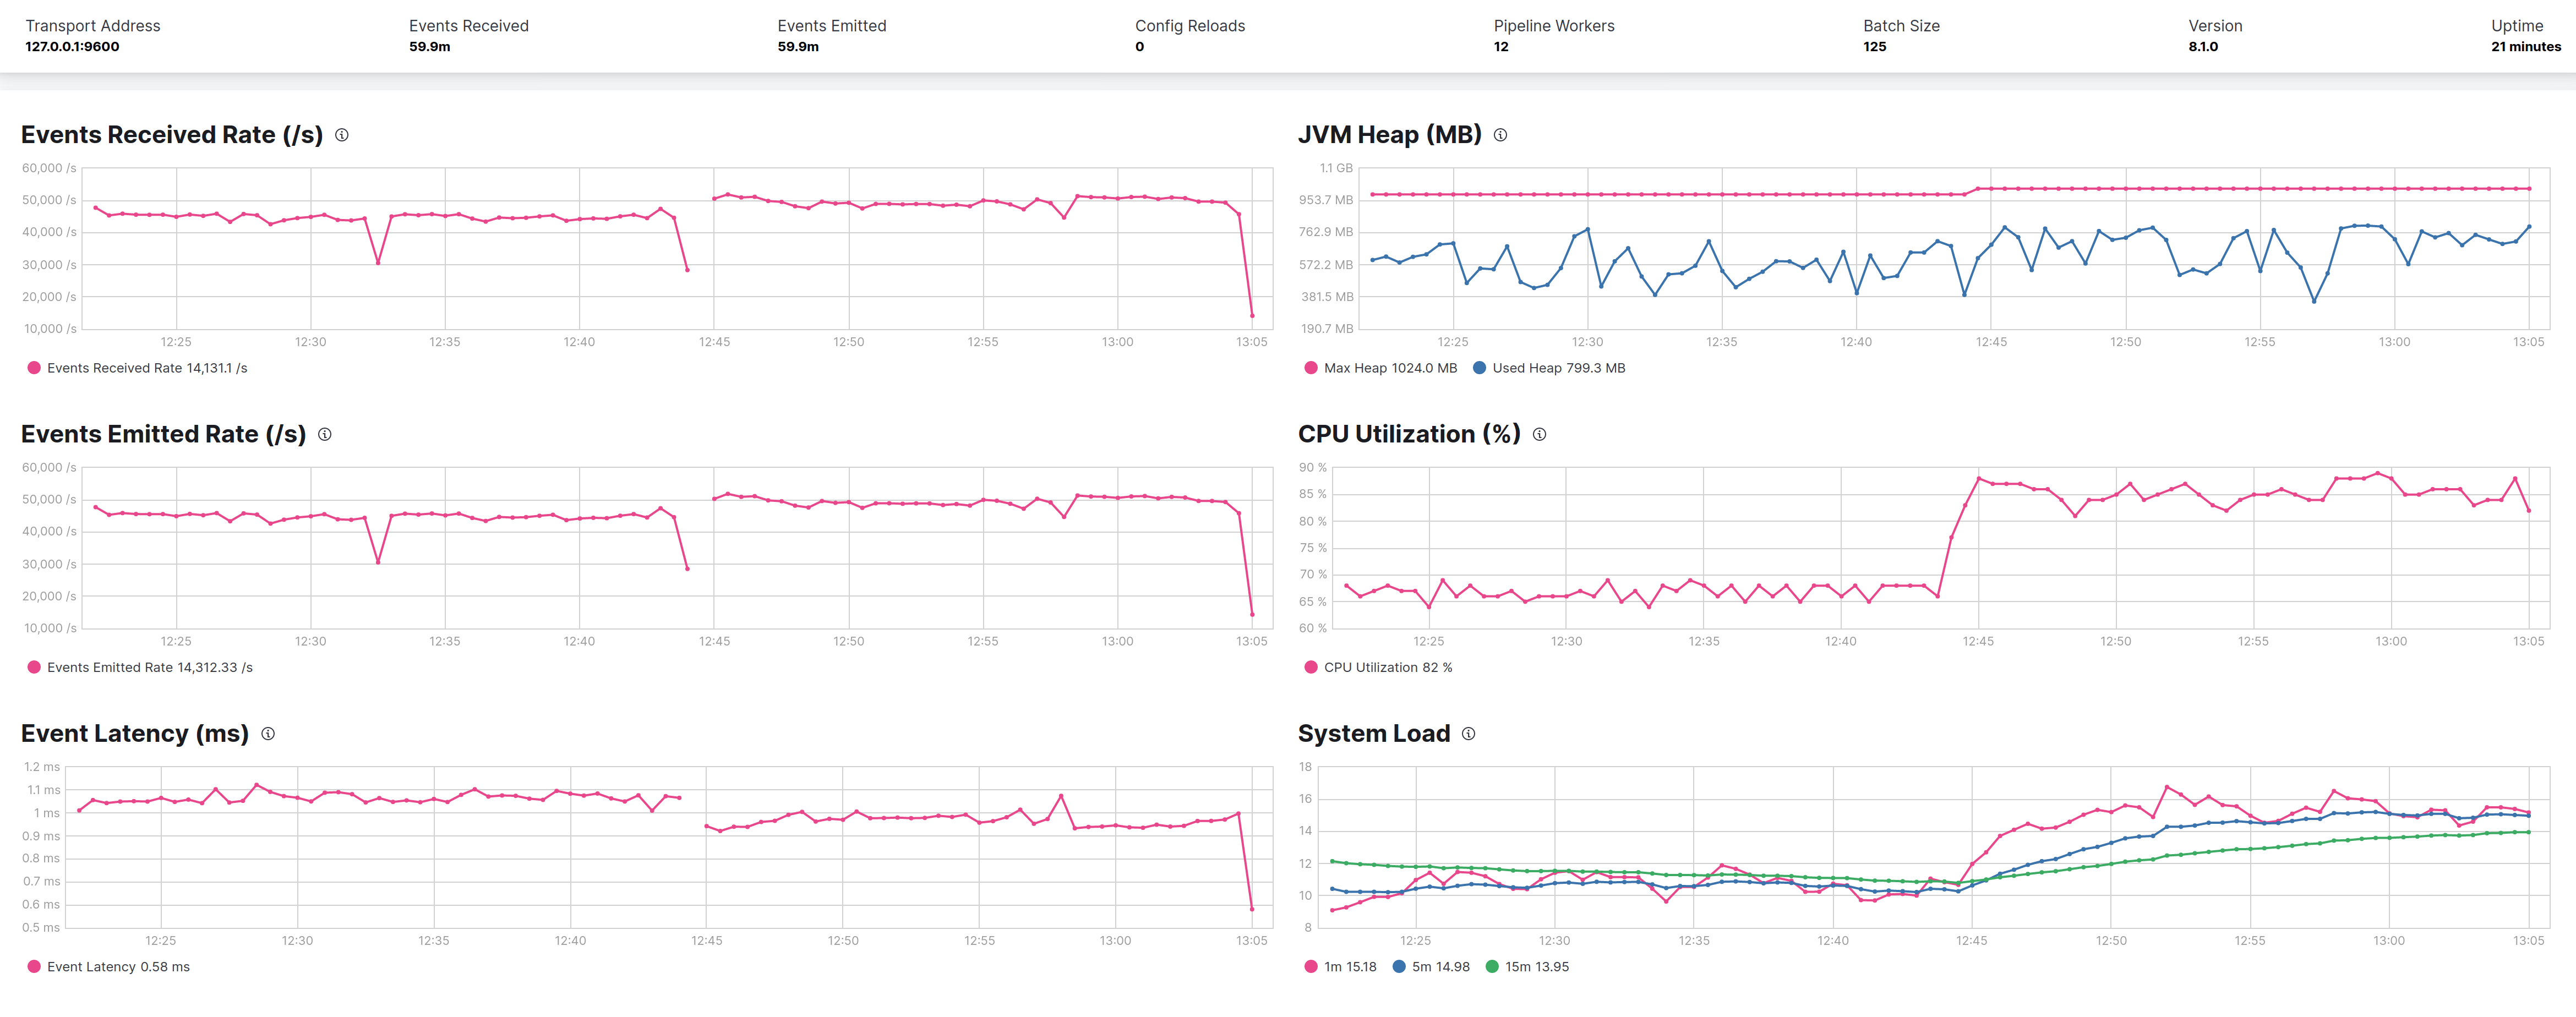
From the graph G1 is 10% better in terms of events throughtput (45K evt/sec CMS 50K evt/sec G1) but pay a penalty in terms of overall CPU consumption. In terms of heap occupancy the two GCs seems the same.
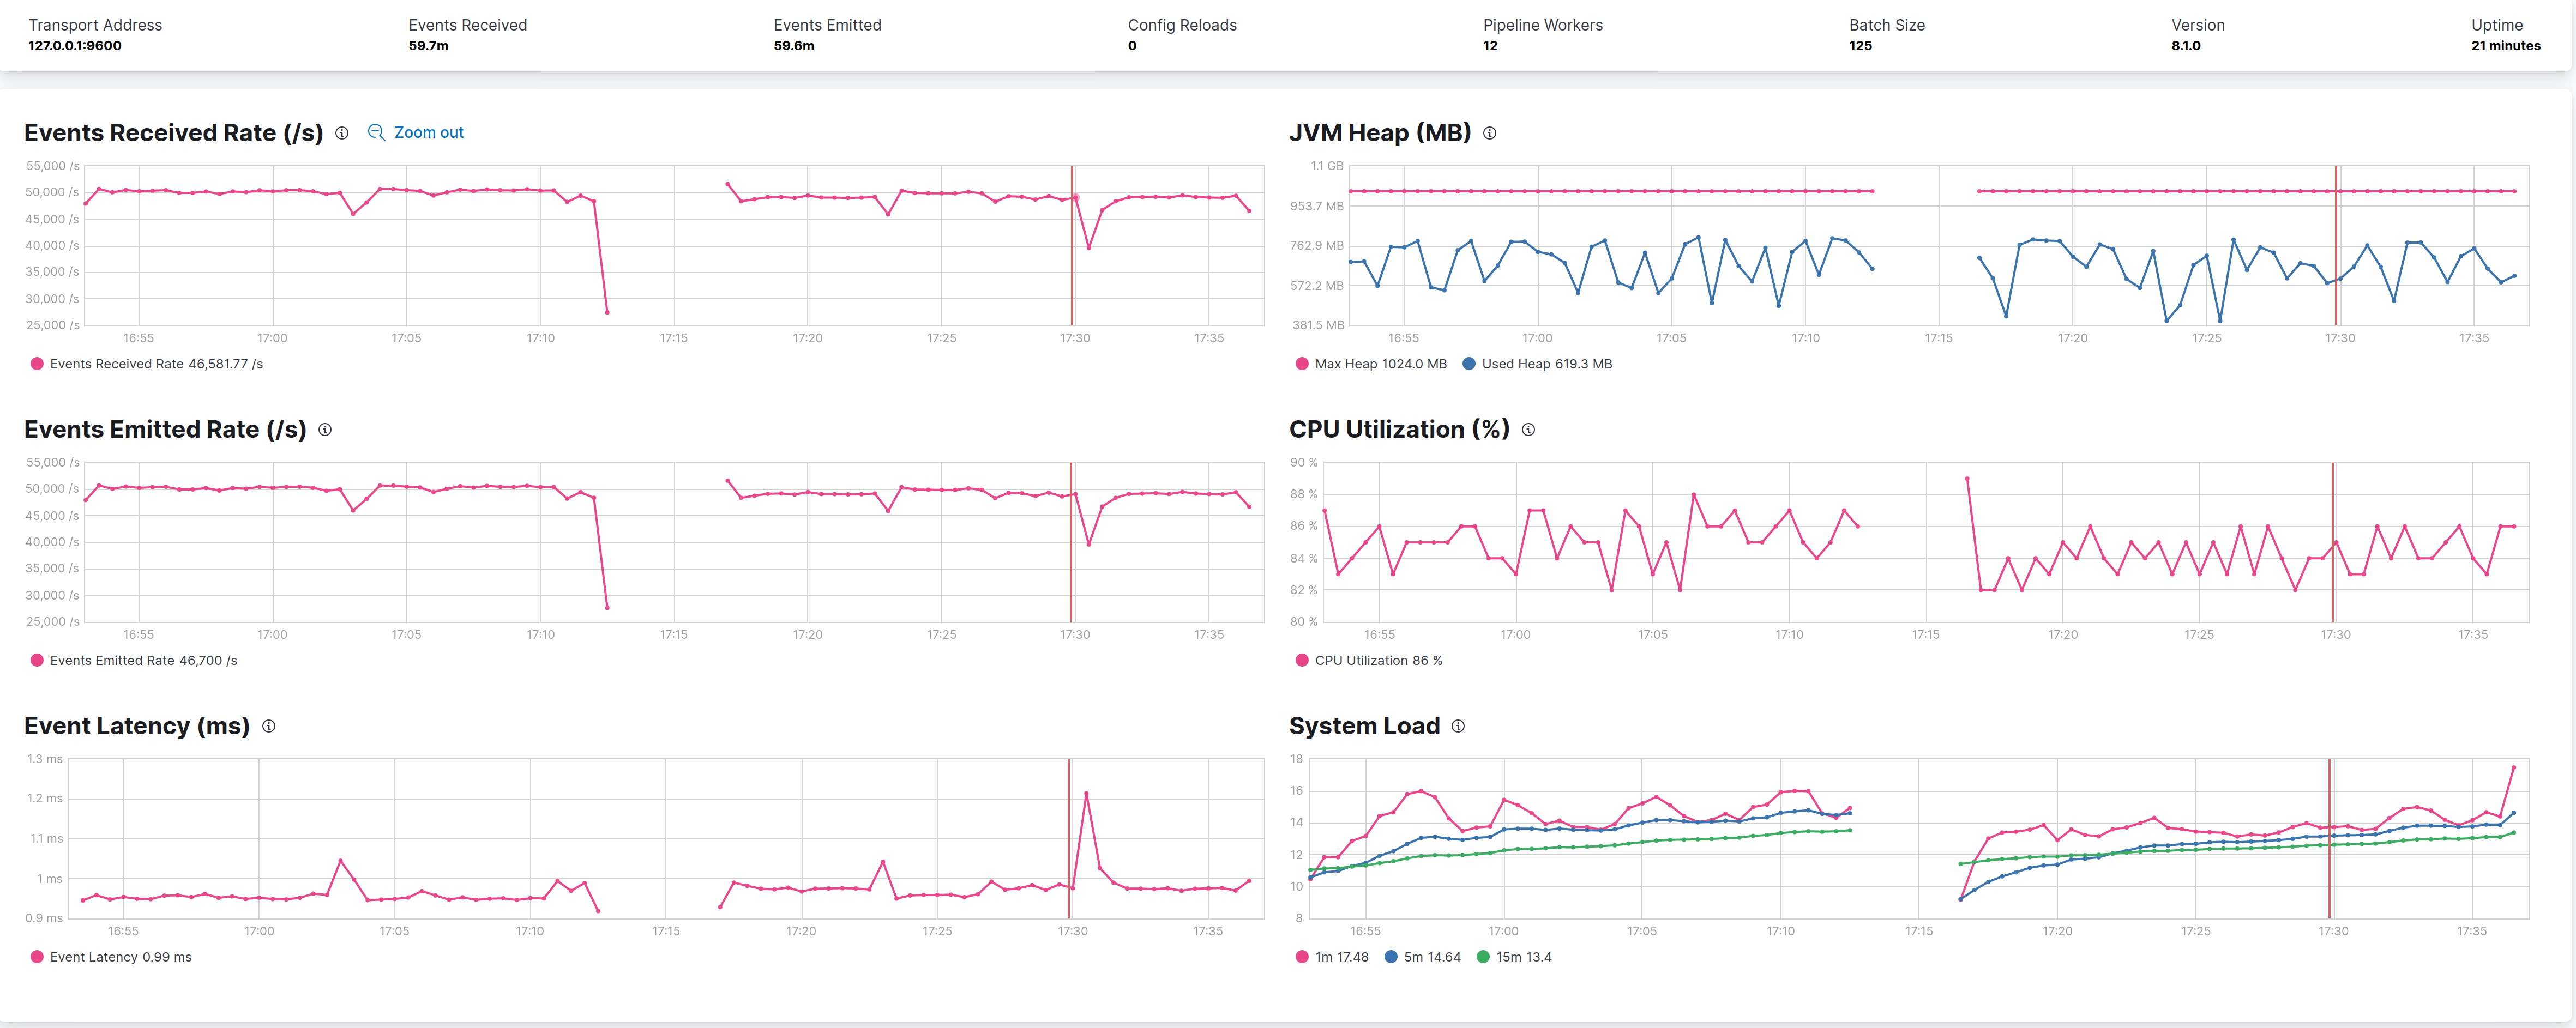
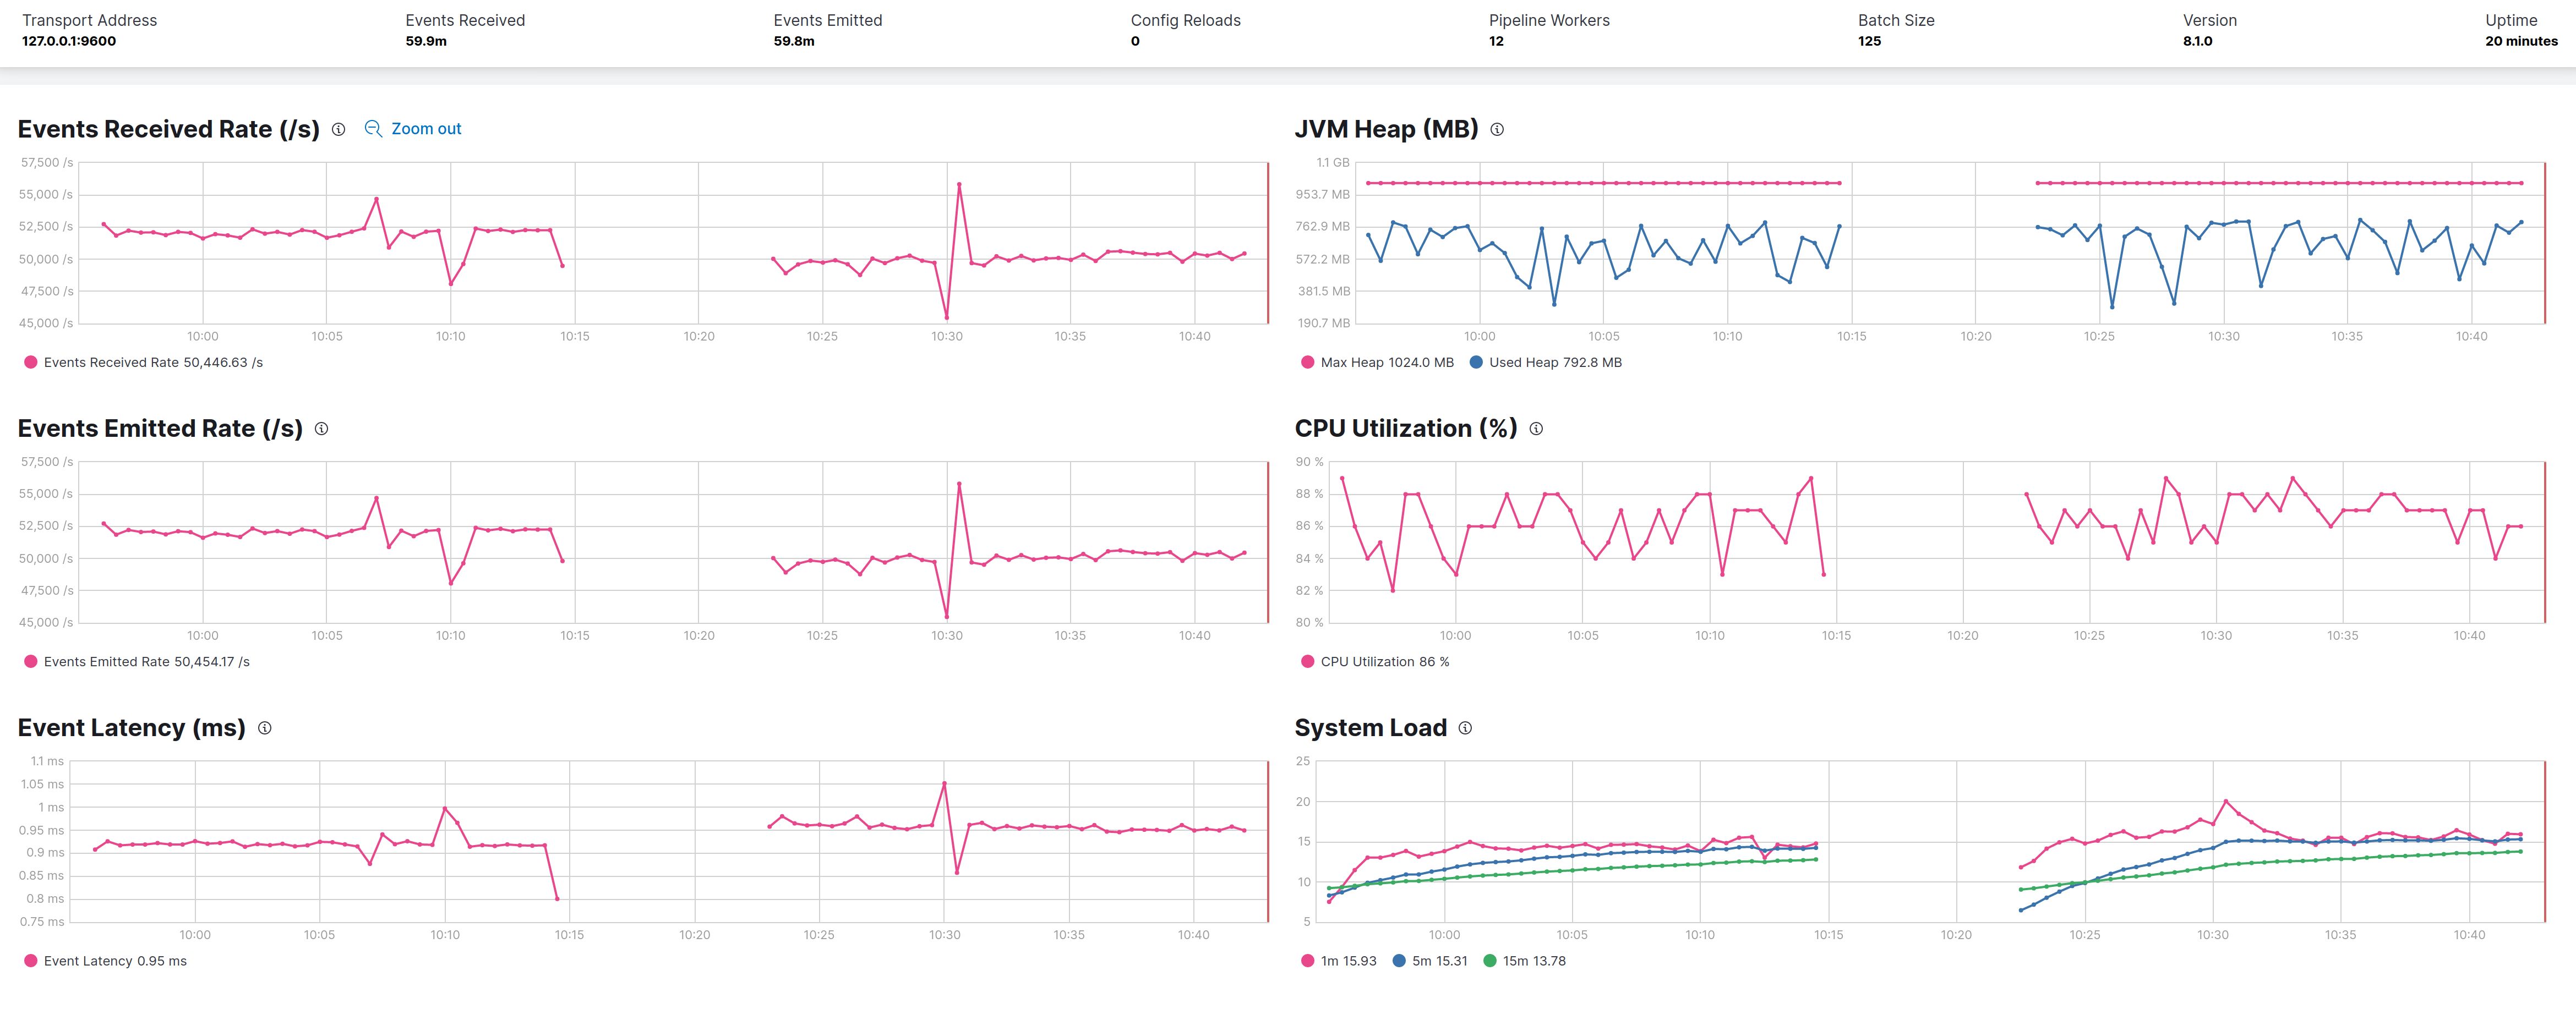
InitiatingHeapOccupancyPercent
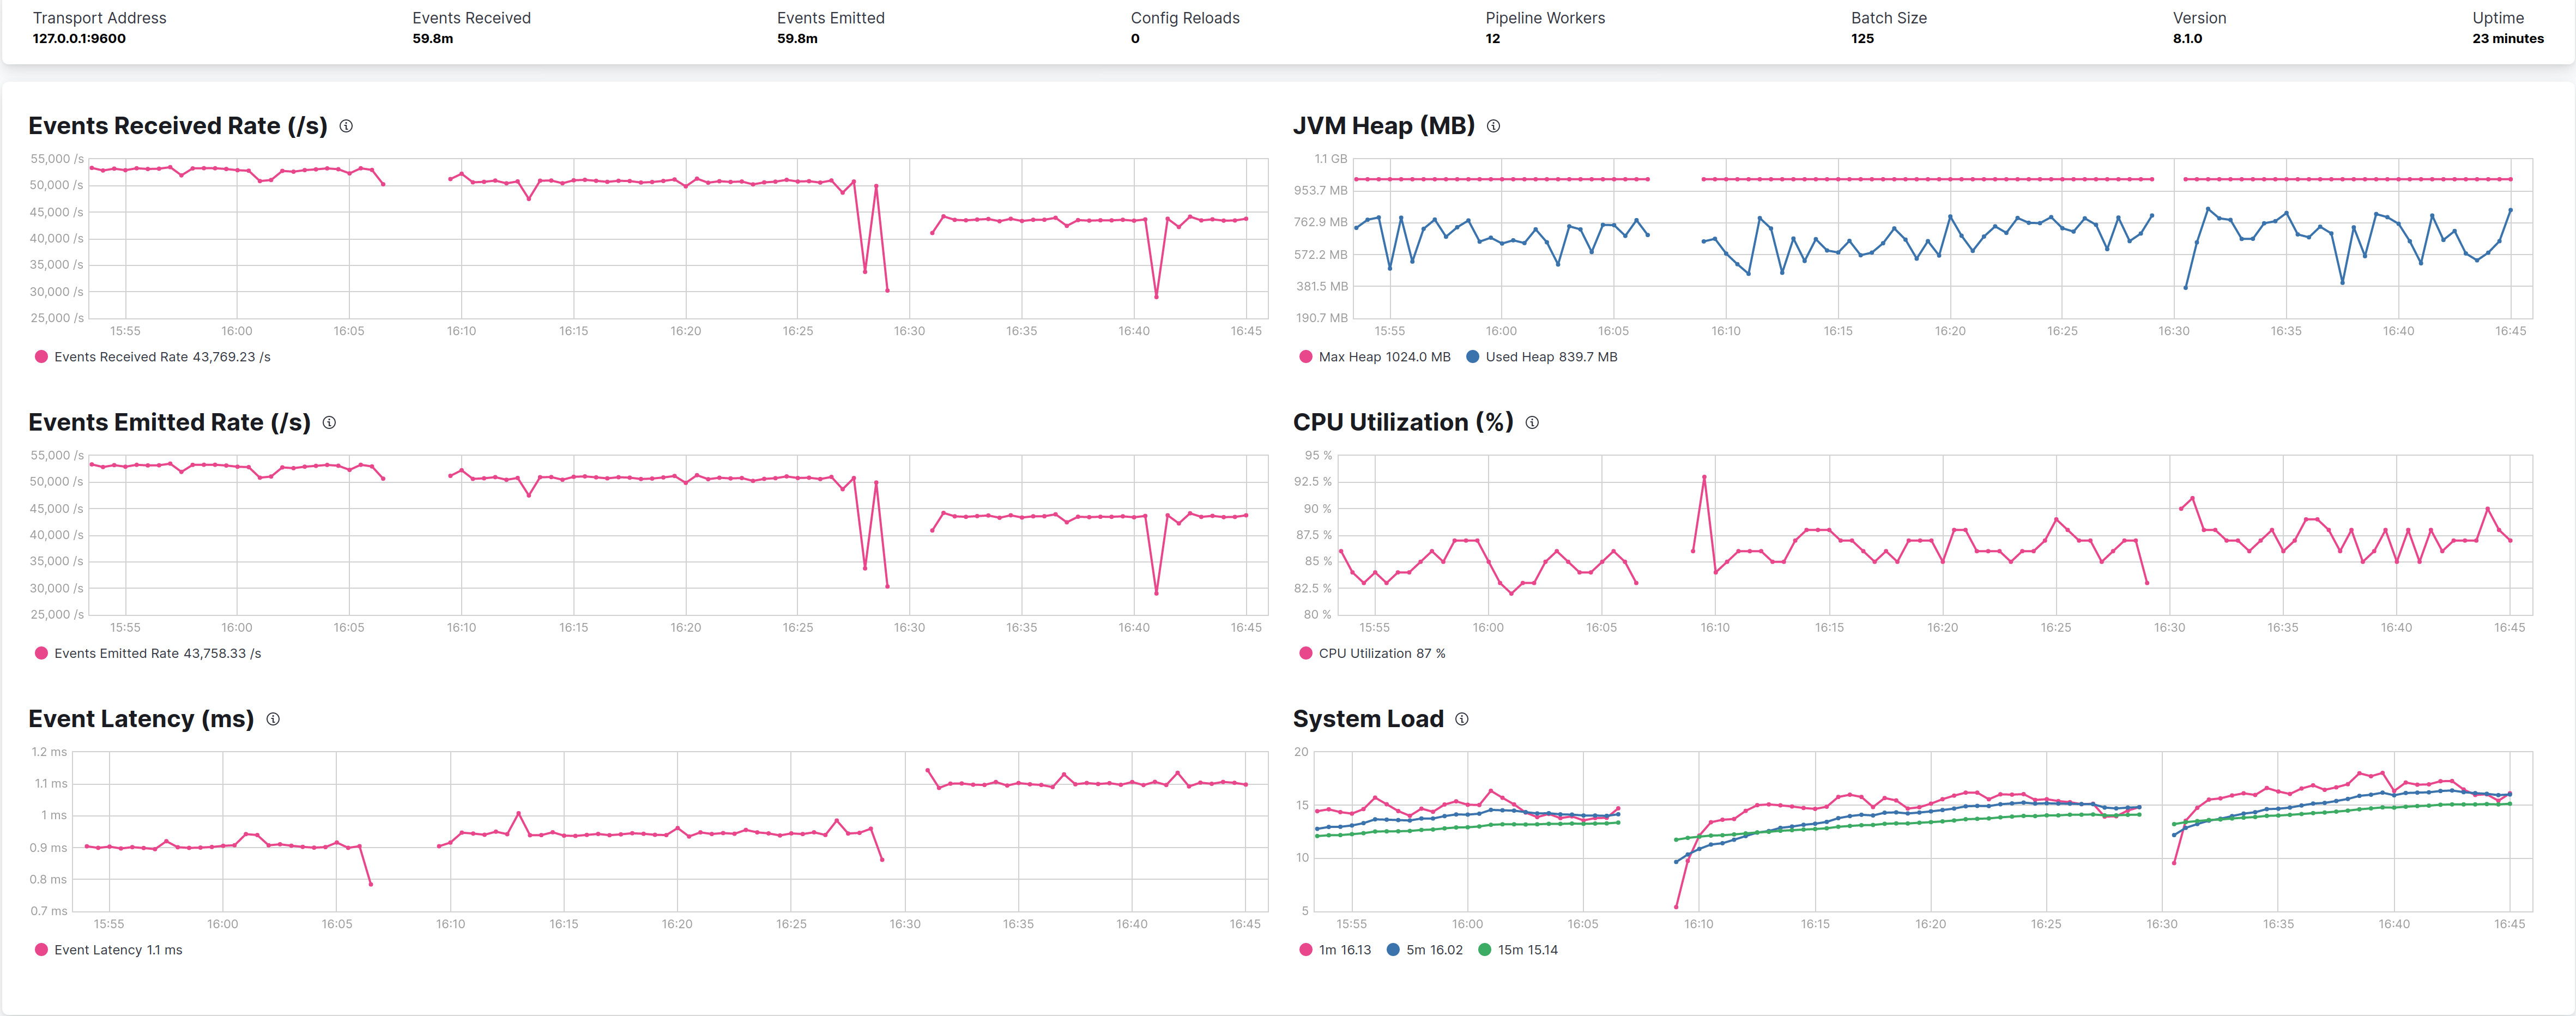
--XXInitiatingHeapOccupancyPercent sets the Java heap occupancy threshold that triggers a marking cycle. The default occupancy is 45 percent of the entire Java heap. I tried with a value of 30 and 15, keeping the MaxGCPauseMillis at 500ms checking how the performance varies. It results that a value of 30 give the best performances while 15 penalize it.
The sequence in graphs is 30% 45% and 15%.
G1ReservePercent
-XX:G1ReservePercent is the percentage of reserve memory to keep free so as to reduce the risk of to-space overflows, is has a default value of 10, the following graph shows the default on the left) against the 25 value used by Elasticsearch, and the only difference is that less heap is used, but with no effects on performances on this use case pipeline.
Conclusions From all the test done with G1 it has been showed that:
- G1 consume more heap than CMS, which is not a bad sign.
- In the defined use case with params
-XX:MaxGCPauseMillis=500 -XX:InitiatingHeapOccupancyPercent=30can perform little better than CMS in terms of throughput (~7% gain) but at a cost of more impact on CPU (~15%).
Weaknesses of the test
- it's focused on a CPU bound pipeline and doesn't do any I/O
- the input is of style "fire as much as you can" instead of a controlled event rate to track the latency
:+1: great work, the 500ms is tempting but I am not convinced it should be set (but also have no objections against).
was wondering if reducing -XX:MaxTenuringThreshold=8 would reduce the increased CPU amount you've seen.
most garbage is short lived (event data) thus the default (15) might be a too high for typical LS use-cases and since G1 also compacts opposed to CMS we might want to help it at least reduce some time spent copying objects around.
some low hanging fruits if we're reviewing and updating config/jvm.options anyway:
-
let's set meta-space size explicitly based on size we're seeing in Logstash (~85M) e.g.
-XX:MetaspaceSize=100Mshould avoid early Full GCs -
-XX:+ParallelRefProcEnabled- parallelize reference processing (enabled since Java 17) -
-XX:+AlwaysPreTouch- helps avoid some latency at runtime
- let's set meta-space size explicitly based on size we're seeing in Logstash .. should avoid early Full GCs
No, because those FullGCs come from explicit invokcation of System.gc() maybe could be avoided with the JVM flag -XX:+DisableExplicitGC
-XX:+ParallelRefProcEnabled- parallelize reference processing (enabled since Java 17)
Tested but as with following image no appreciable improvements, maybe a little loss. On left the flag is disabled on right is enabled
-XX:+AlwaysPreTouch- helps avoid some latency at runtime
Same here, no improvements (at least qualitatively), on left the flag is disable, on right is enabled
yeah those low hanging flags weren't mean to make a difference - just to check everything is the same as before ...
even reducing -XX:MaxTenuringThreshold=8 might not show much but would be interesting to see if CPU usage drops a bit.
Hi @kares tried with -XX:MaxTenuringThreshold=8 (on the right) but CPU consumption keeps the same while throughput is lower about ~2K evt/sec
Here are my results: https://gist.github.com/jsvd/4ccbc1776f3bc1679e4751aa0a9500be
Key takeaways:
- in a medium complexity pipeline, 1gb heaps hinder throughput and latency when compared to 4gb heaps;
- throughput-wise, with 4gb heaps size, Java 17 w/ G1 performs better than Java 11 w/CMS;
- Regarding G1, tweaks to flags such as MaxGCPauseMillis, InitiatingHeapOccupancyPercent and G1ReservePercent didn't show significant improvement in performance or latency.
- Process wise, we don't have a reproducible tool to capture throughput and latency (including percentiles), which severely limits the ability to do benchmarking and decide on performance configuration.
No, we could eventually define some configurations that we can use to benchmark Logstash in different uses cases, so that we can spend less time in thinking how to test next time we come down to the same theme.