elastic-charts
 elastic-charts copied to clipboard
[Heatmap] Tooltip synchronization
Is your feature request related to a problem? Please describe. In kibana dashboards we have the following functionality:
- When an XY chart panel is embedded on a dashboard the cursor synchronization is enabled by default
- There is a setting 'Sync tooltip across panels' that enables the tooltip synchronization among panels


We are going to add the cursor synchronization feature for heatmap charts too and we would like to also enable the tooltip synchronization.
This is not available atm https://elastic.github.io/elastic-charts/?path=/story/interactions--multi-chart-cursor-sync&globals=theme:light (on this example the tooltips are synchronized among the XY charts but not on the heatmap)
Describe the solution you'd like I wonder if we can also enable the tooltip synchronization for heatmaps. Is it possible? What needs to be done in order to enable this functionality?
Checklist
- [x] this request is checked against already exist requests
Hey @gvnmagni & @markov00 this request requires us to show a tooltip for a given x value. Currently, the heatmap tooltip requires both x and y values. Can we create a tooltip design that shows the x category with a list of the y categories and possibly the respective values?
Few things to consider:
- we can have a very long tooltip due to the number of categories along the Y axis. What do we expect to render there? just the first 5 elements on the top?
- we need to well define what should be synchronized: only the X, only the Y, both?
- @stratoula we should consider reducing the current debounce time used to sync tooltips across charts. This could increase a bit the computation overhead but it smooths the interaction (you can change it in the
<Settings pointerUpdateDebounce={} />)
We did it for TSVB (added pointerUpdateDebounce={0}). We saw that it smooths the experience especially for long series. Is 0 the correct value here? Wdyt? If yes I can add this prop to all the charts that enable this feature.
I just saw your PR https://github.com/elastic/kibana/pull/143186 :)
0 mean that we send events immediately on every change in cursor position (not screen pixel change, but one event every time the projected value of the cursor has changed. In particular if you have a dense time raster and you move fast your mouse the events could be triggered at 60fps. It could create probably some performances issue only when you have a lot of synchronized charts on the same page all of them showing tooltips. This also depends on the way you share across charts, (if I remember well in the pass there was something like a jQuery bus that was taking care of that, is still the case?)
We changed that. Here is the implementation we are using now https://github.com/elastic/kibana/blob/main/src/plugins/charts/public/services/active_cursor/use_active_cursor.ts
I actually don't know what to do here in terms of tooltip: I actually don't think we should show the tooltip of each Y value on the heatmap. It doesn't have much sense as it could be very long depending on the number of categories on the Y axis. @gvnmagni any suggestions here?
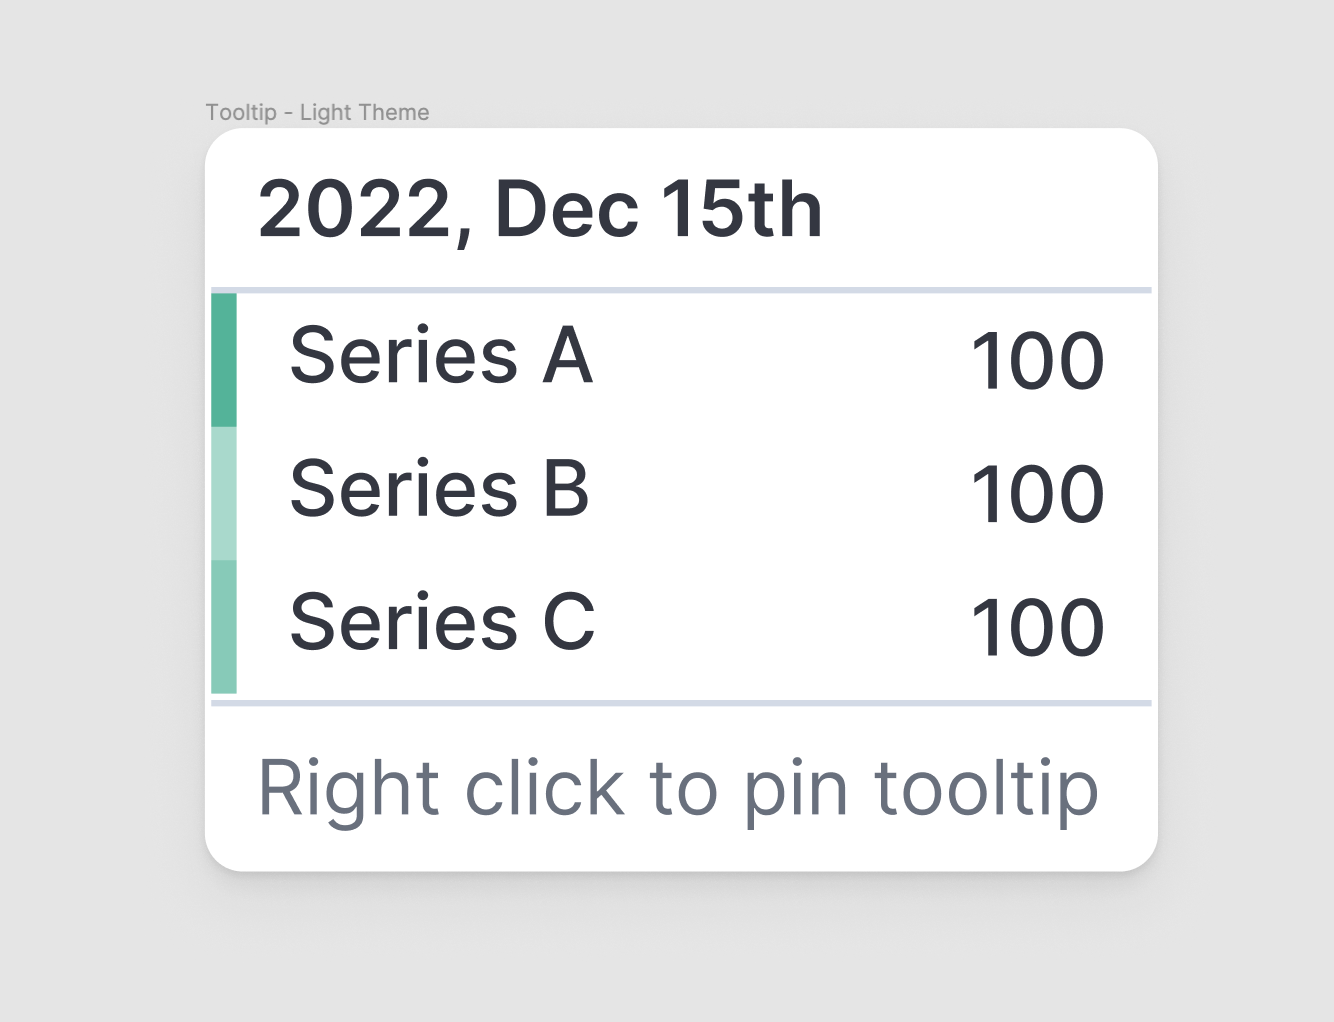
I want to be sure that I got this right. All these values on the heatmap share the same Y value (date) and therefore they could be aggregated by that. This means that we could use a classic tooltip like the one shown below, is that correct?
We only need to decide where to place it on the heatmap
@gvnmagni sure, but what if we have 15 categories on the Y axis? we don't want to show a long tooltip, and showing only the "top 5" doesn't have much sense, so what to do in this case?
Does it make sense to keep following the behavior we implemented for our new tooltip? We show only a certain number and if we click on any chart, the tooltip get pinned and show everything.
I'm not saying this should be the solution, just evaluating options
Well, I know it's a weird concept, but since they are synchronised maybe the pinning could be synchronised as well
We revisited that today and we agreed that the heatmap syncronized tooltip can be shown as proposed by giovanni above where:
- the time/X is in the header
- each row shows in the first column the Y value and in the second column the cell value
We are going to show up to 5 items maximum. We need to decide if the 5 items are the ones with the higher/lower values or are the first 5 elements on the Y axis.
We can see, in a subsequent phase if we want to enable the pinning capability providing a way to pin and scroll the tooltip